-
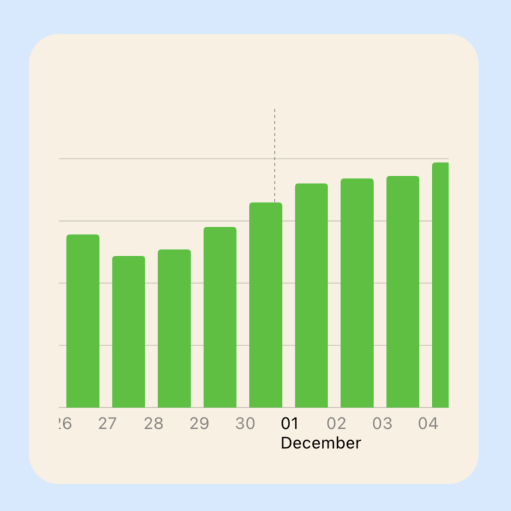 Apple introduced SwiftUI Charts at WWWDC 2022, which makes it incredibly easy to create charts within SwiftUI views. The default chart presents the entire data in the chart plot regardless of how much data is available. It can be beneficial to show more details on a chart and add the ability to scroll through the …
Read More -
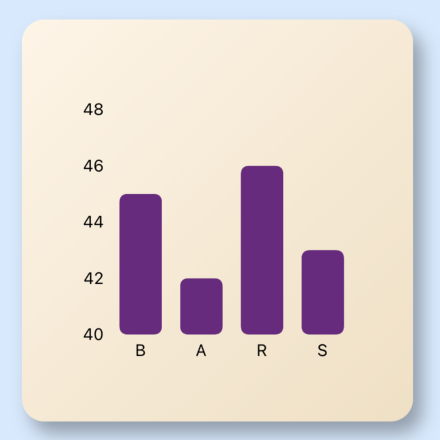 There are times when data in a bar chart has similar values for a number of the bars and it can be difficult to see the differences. One option is to zoom in on the top section of the bar chart. This article investigates a number of options and identifies the best approach for this in Swift Charts.
Read More -
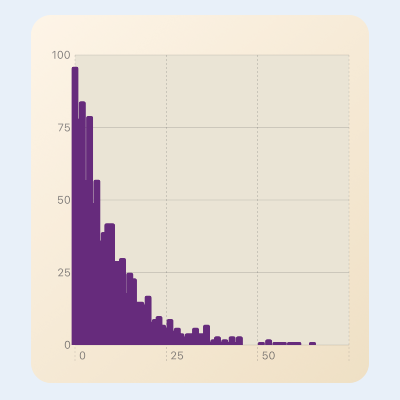 I came across the Matthew effect recently, which struck me as very unfair so I wondered if I could reproduce the results demonstrated. This article outlines the Swift code for an app to test the redistribution of coins in a closed population based on random coin tosses between agents in the population.
Read More -
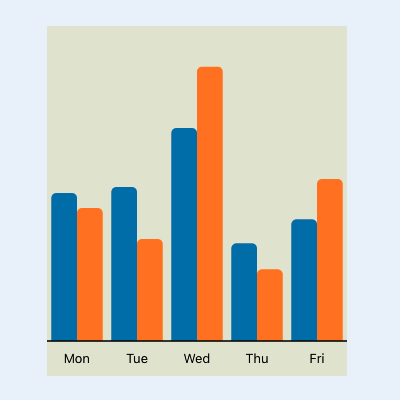
 At WWWDC 2022, Apple introduced SwiftUI Charts, which makes it easy to create various charts within SwiftUI views. This article demonstrates how to quickly create a bar chart and customise the chart containing multiple sets of data.
Read More -
 Horizontal Bar Charts present categories of data as rectangular bars with the widths proportional to the values they represent. This article shows how to build on the vertical bar chart to create a horizontal bar chart.
Read More -
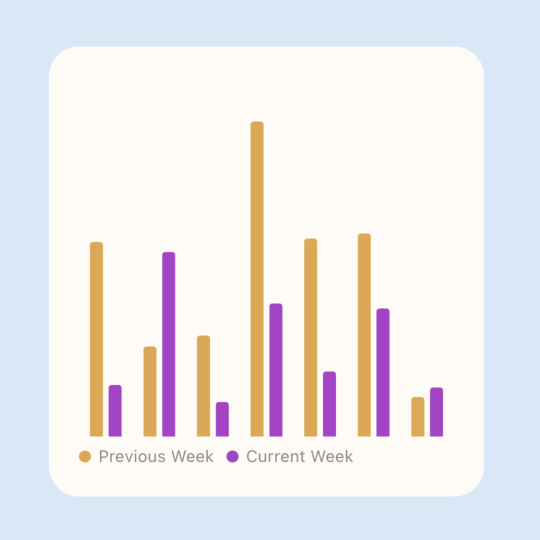
 A vertical Bar Chart presents categories of data as bars with the heights proportional to the values they represent. This article shows how to enhance the basic bar chart by displaying data with multiple sets of data for each category. In the bar chart, the bars are grouped into their categories and color is used for …
Read More -
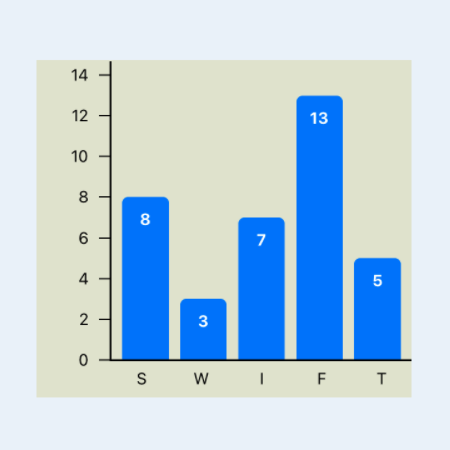
 In previous articles we created bar charts in SwiftUI and then added x and y axis to the chart. The bar chart can look cleaner without one or both axes, so in this article, we will customise the bar chart to show or hide the axes.
Read More -
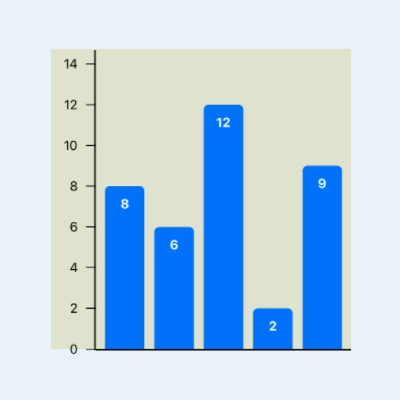
 A vertical Bar Chart presents categories of data as bars with the heights proportional to the values they represent, the y-axis is used to show the height and the x-axis is used to show the category values. This article shows how to enhance the basic bar chart described in How to create a Bar Chart in SwiftUI by adding …
Read More -
-
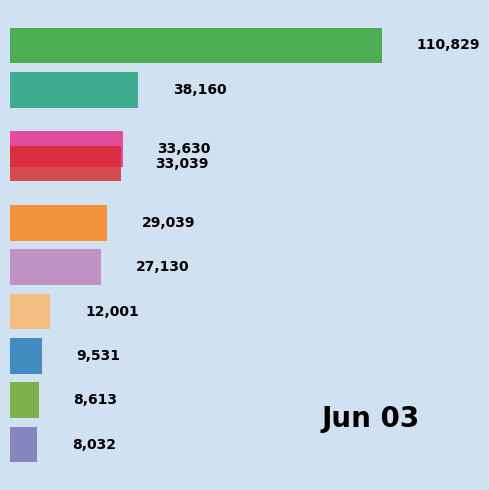 COVID-19 is the disease caused by a new coronavirus called SARS-CoV-2. World Health Organisation (WHO) first learned of the virus on 31 December 2019. The WHO declared the coronavirus outbreak a pandemic in March 2020. This article will show how to create a bar chart race depicting the countries with the highest …
Read More