-
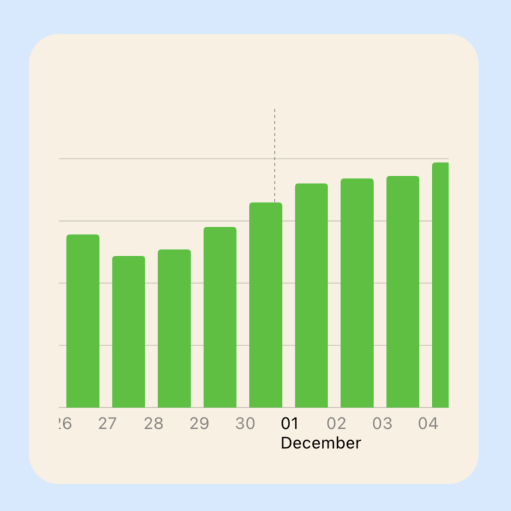 Apple introduced SwiftUI Charts at WWWDC 2022, which makes it incredibly easy to create charts within SwiftUI views. The default chart presents the entire data in the chart plot regardless of how much data is available. It can be beneficial to show more details on a chart and add the ability to scroll through the …
Read More -
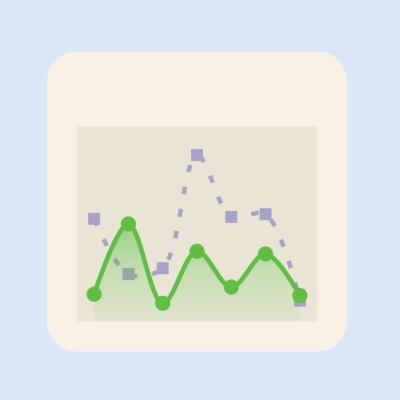 SwiftUI Charts introduced in iOS 16, can present data in an intuitive visual format and can be created quickly using SwiftUI Charts. This article demonstrates a couple of ways to customise a line chart and combine with an area chart to present data.
Read More -
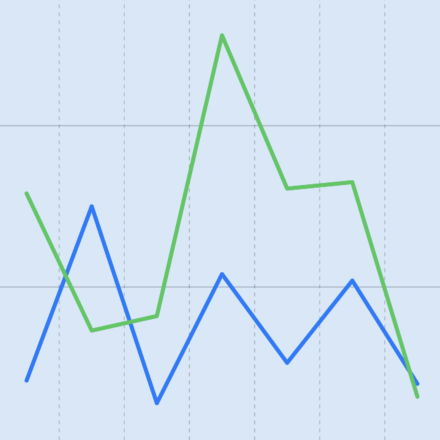 Apple introduced SwiftUI Charts at WWWDC 2022, which makes it incredibly easy to create charts within SwiftUI views. Charts are a great way of presenting visual data in a rich format that is easy to understand. This article shows how to easily create a line chart with so much less code than was previously used to …
Read More -
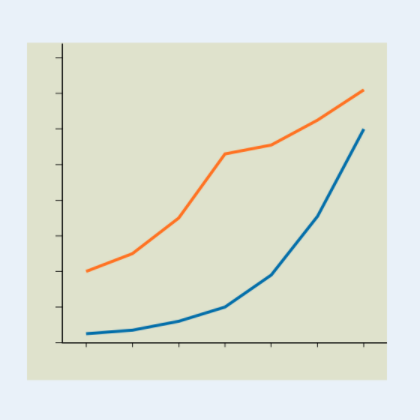 A line chart is a graphical representation of changes in some data over time or between categories. The chart consists of two axes; x-axis is the horizontal axis representing the time change; and y-axis is the vertical axis representing the magnitude of the data. This article demonstrates how to create simple line …
Read More