Hide Bar Chart Axes in SwiftUI
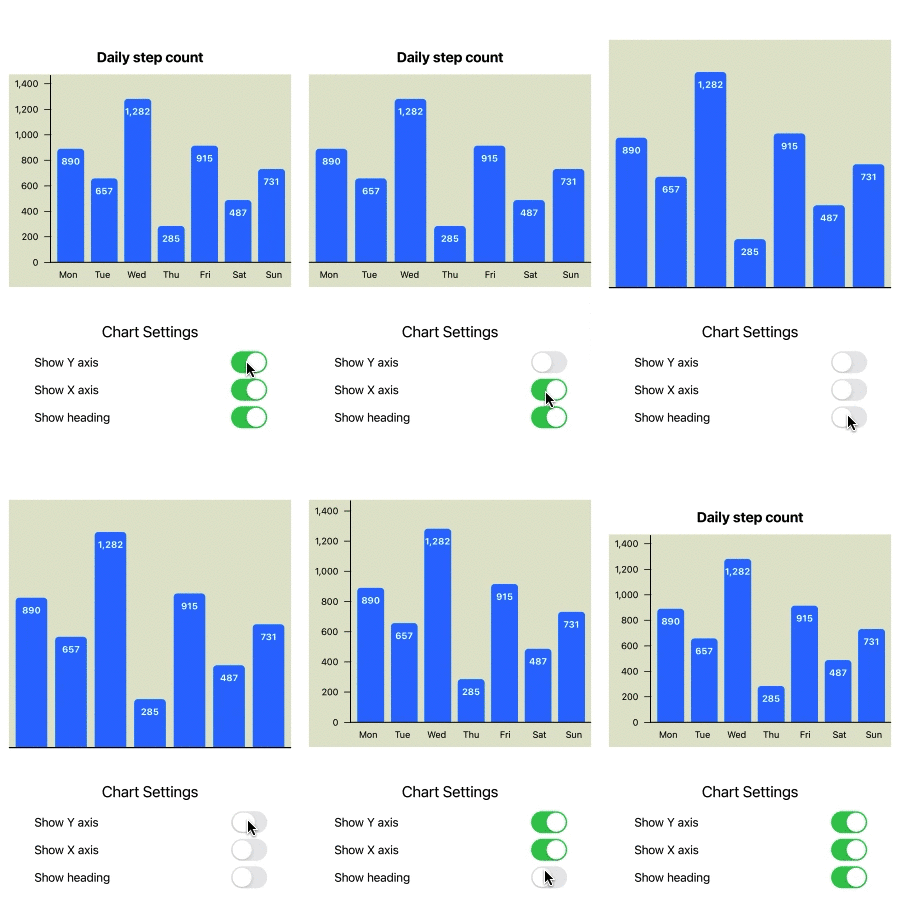
In previous articles we created bar charts in SwiftUI and then added x and y axis to the chart. The bar chart can look cleaner without one or both axes, so in this article, we will customise the bar chart to show or hide the axes.
- How to create a Bar Chart in SwiftUI
- Add Axes to a Bar Chart in SwiftUI
- Hide Bar Chart Axes in SwiftUI
- Bar Chart with multiple data sets in SwiftUI
- Horizontal Bar Chart in SwiftUI
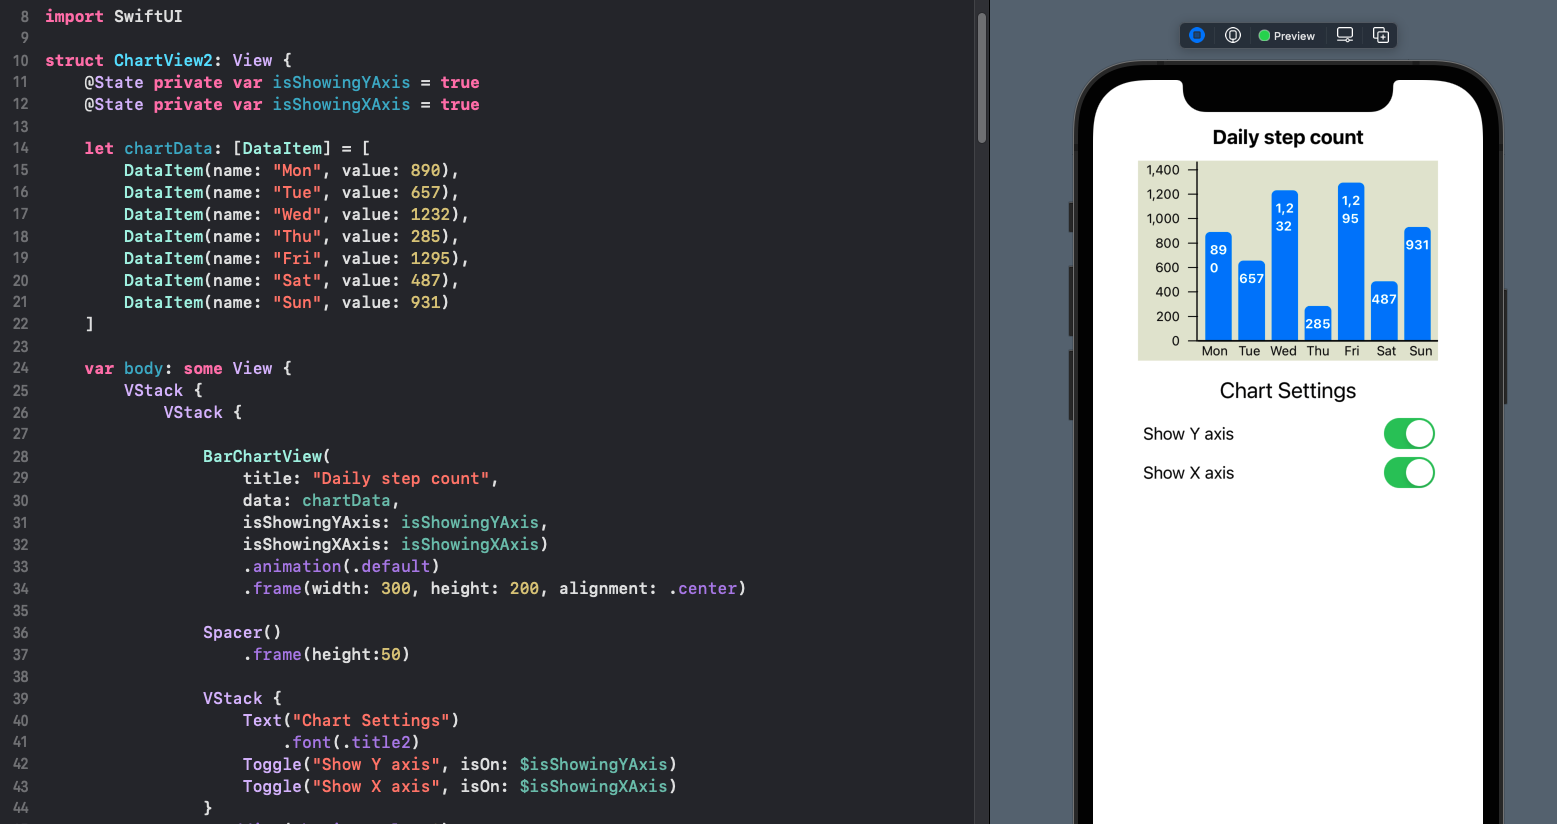
Add State property for showing the Axes
Add properties to the view to store the state of whether the x and y axes are
displayed on the bar chart. There is a property for each axis, as each one can be
shown or hidden independently. Toggle controls are added to the view and a
default animation is added to the BarChartView for a smooth transition when
switching the axis on or off.
 1struct ChartView2: View {
 2    @State private var isShowingYAxis = true
 3    @State private var isShowingXAxis = true
 4
 5    let chartData: [DataItem] = [
 6        DataItem(name: "Mon", value: 890),
 7        DataItem(name: "Tue", value: 657),
 8        DataItem(name: "Wed", value: 1232),
 9        DataItem(name: "Thu", value: 285),
10        DataItem(name: "Fri", value: 1295),
11        DataItem(name: "Sat", value: 487),
12        DataItem(name: "Sun", value: 931)
13    ]
14
15    var body: some View {
16        VStack {
17            VStack {
18
19                BarChartView(
20                    title: "Daily step count",
21                    data: chartData,
22                    isShowingYAxis: isShowingYAxis,
23                    isShowingXAxis: isShowingXAxis)
24                    .animation(.default)
25                    .frame(width: 300, height: 250, alignment: .center)
26
27                Spacer()
28                    .frame(height:50)
29
30                VStack {
31                    Text("Chart Settings")
32                        .font(.title2)
33                    Toggle("Show Y axis", isOn: $isShowingYAxis)
34                    Toggle("Show X axis", isOn: $isShowingXAxis)
35                }
36                .padding(.horizontal, 50)
37
38                Spacer()
39            }
40        }
41    }
42}
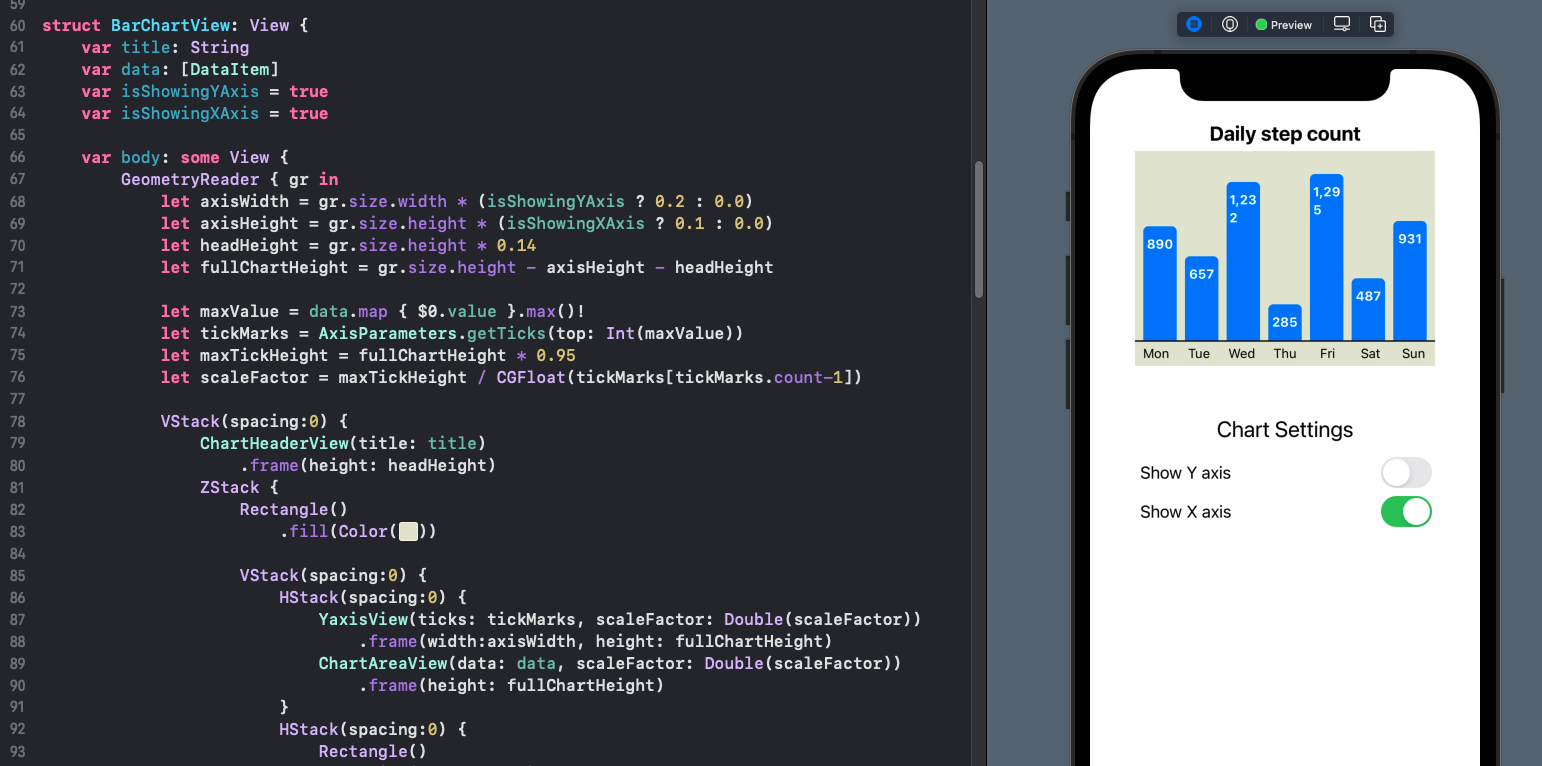
Add member variables to the BarChartView
The BarChartView is updated to have similar boolean parameters for showing the x
and y axes. These are set with default values of true, so the axes are shown by
default. The calculation of the axis width and axis height are updated to use the new
parameters, setting the width of the axis to zero if isShowingYAxis is false. The
full chart height is then adjusted when the x-axis is not shown.
 1struct BarChartView: View {
 2    var title: String
 3    var data: [DataItem]
 4    var isShowingYAxis = true
 5    var isShowingXAxis = true
 6
 7    var body: some View {
 8        GeometryReader { gr in
 9            let axisWidth = gr.size.width * (isShowingYAxis ? 0.2 : 0.0)
10            let axisHeight = gr.size.height * (isShowingXAxis ? 0.1 : 0.0)
11            let headHeight = gr.size.height * 0.14
12            let fullChartHeight = gr.size.height - axisHeight - headHeight
13
14            let maxValue = data.map { $0.value }.max()!
15            let tickMarks = AxisParameters.getTicks(top: Int(maxValue))
16            let maxTickHeight = fullChartHeight * 0.95
17            let scaleFactor = maxTickHeight / CGFloat(tickMarks[tickMarks.count-1])
18
19            VStack(spacing:0) {
20                ChartHeaderView(title: title)
21                    .frame(height: headHeight)
22                ZStack {
23                    Rectangle()
24                        .fill(Color(#colorLiteral(red: 0.8906477705, green: 0.9005050659, blue: 0.8208766097, alpha: 1)))
25
26                    VStack(spacing:0) {
27                        HStack(spacing:0) {
28                            YaxisView(ticks: tickMarks, scaleFactor: Double(scaleFactor))
29                                .frame(width:axisWidth, height: fullChartHeight)
30                            ChartAreaView(data: data, scaleFactor: Double(scaleFactor))
31                                .frame(height: fullChartHeight)
32                        }
33                        HStack(spacing:0) {
34                            Rectangle()
35                                .fill(Color.clear)
36                                .frame(width:axisWidth, height:axisHeight)
37                            XaxisView(data: data)
38                                .frame(height:axisHeight)
39                        }
40                    }
41                }
42            }
43        }
44    }
45}
This works correctly for the y-axis, but there is a problem with the x-axis. The height is adjusted and the bar chart scales to fill the space, but the x-axis line is still shown as well as the labels.
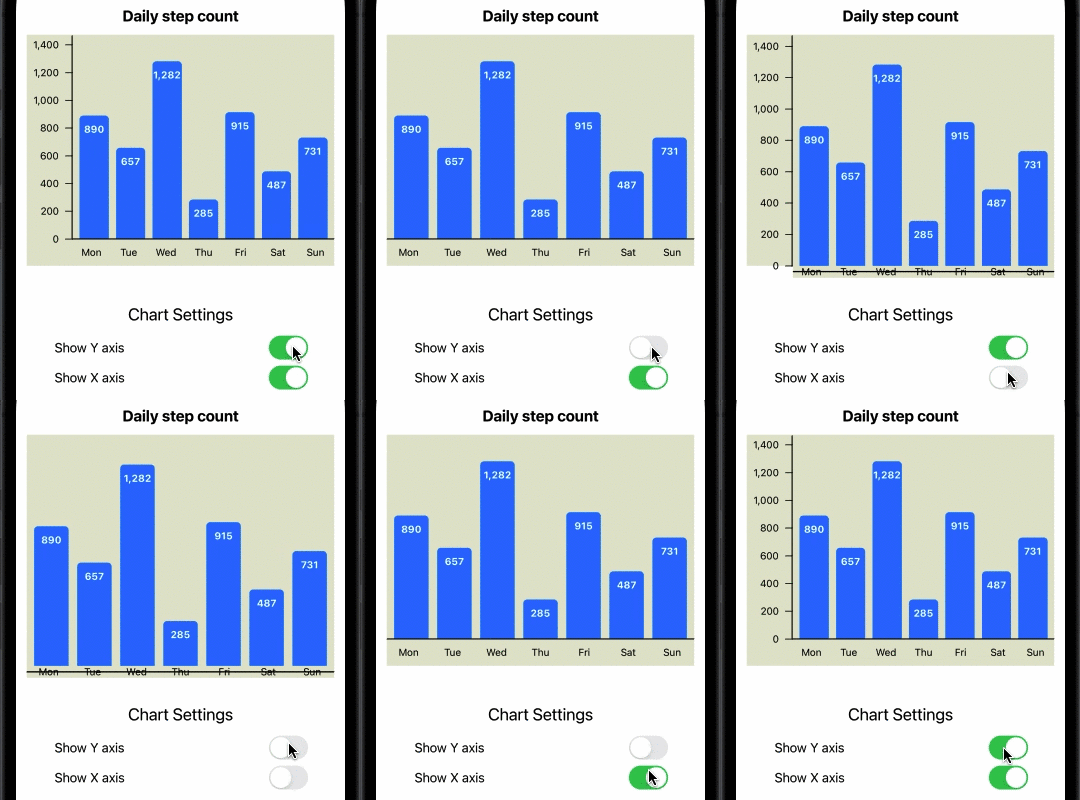
Issue with hiding the x-axis on bar chart
Hide x-axis
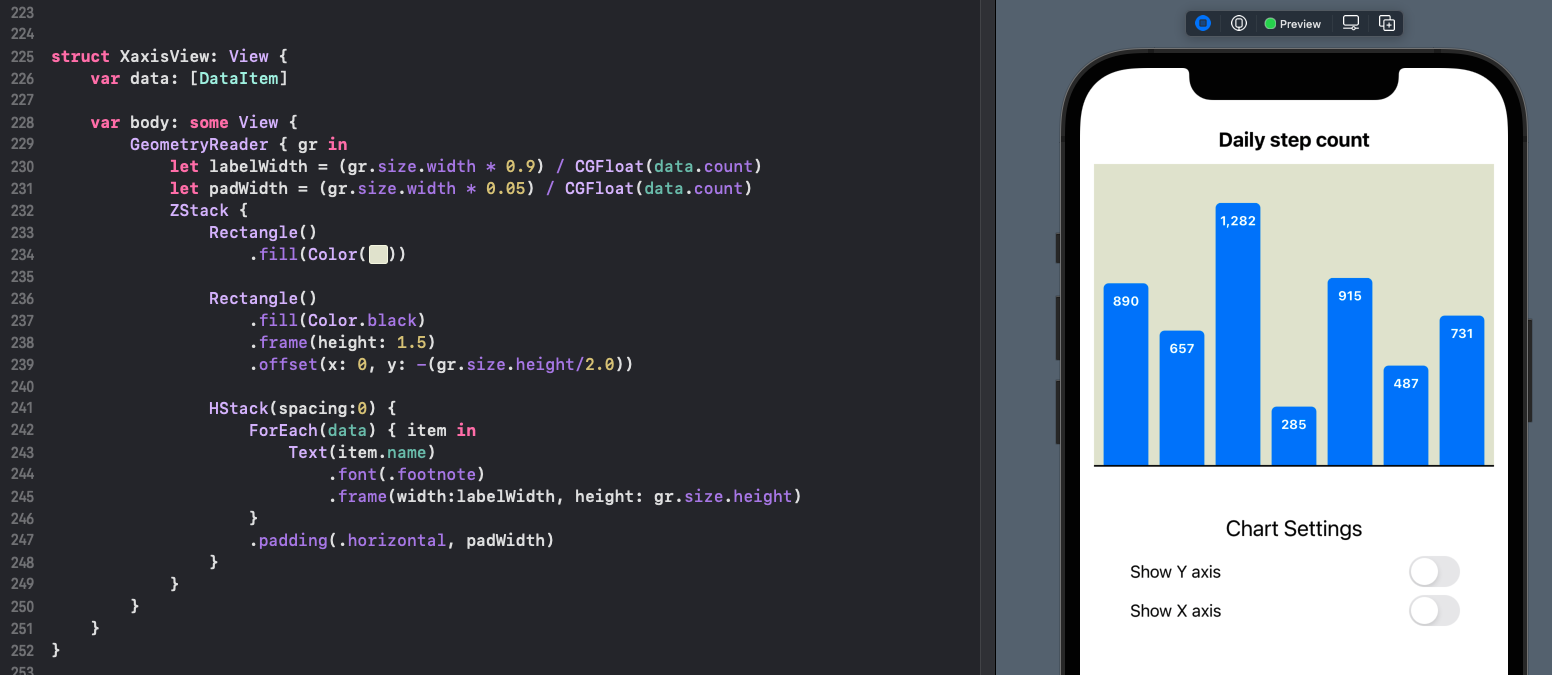
The reason the labels on the x-axis are displayed is that each item name is displayed in a Text view with only the width set. This can be modified to use the GeometryReader height, so that when this height is set to zero, the labels are not displayed. The x-axis line is left in place as the the bars seemed lost without the baseline.
1. . .
2        Text(item.name)
3            .font(.footnote)
4            .frame(width:labelWidth)
5. . .
 1struct XaxisView: View {
 2    var data: [DataItem]
 3
 4    var body: some View {
 5        GeometryReader { gr in
 6            let labelWidth = (gr.size.width * 0.9) / CGFloat(data.count)
 7            let padWidth = (gr.size.width * 0.05) / CGFloat(data.count)
 8            ZStack {
 9                Rectangle()
10                    .fill(Color(#colorLiteral(red: 0.8906477705, green: 0.9005050659, blue: 0.8208766097, alpha: 1)))
11
12                Rectangle()
13                    .fill(Color.black)
14                    .frame(height: 1.5)
15                    .offset(x: 0, y: -(gr.size.height/2.0))
16
17                HStack(spacing:0) {
18                    ForEach(data) { item in
19                        Text(item.name)
20                            .font(.footnote)
21                            .frame(width:labelWidth, height: gr.size.height)
22                    }
23                    .padding(.horizontal, padWidth)
24                }
25            }
26        }
27    }
28}
Hide the heading
A similar mechanism can be used to show or hide the heading on the bar chart.
 1struct ChartView2: View {
 2    @State private var isShowingYAxis = true
 3    @State private var isShowingXAxis = true
 4    @State private var isShowingHeading = true
 5
 6    let chartData: [DataItem] = [
 7        DataItem(name: "Mon", value: 890),
 8        DataItem(name: "Tue", value: 657),
 9        DataItem(name: "Wed", value: 1282),
10        DataItem(name: "Thu", value: 285),
11        DataItem(name: "Fri", value: 915),
12        DataItem(name: "Sat", value: 487),
13        DataItem(name: "Sun", value: 731)
14    ]
15
16    var body: some View {
17        VStack {
18            VStack {
19
20                BarChartView(
21                    title: "Daily step count",
22                    data: chartData,
23                    isShowingYAxis: isShowingYAxis,
24                    isShowingXAxis: isShowingXAxis,
25                    isShowingHeading: isShowingHeading)
26                    .animation(.default)
27                    .frame(width: 400, height: 350, alignment: .center)
28
29                Spacer()
30                    .frame(height:50)
31
32                VStack {
33                    Text("Chart Settings")
34                        .font(.title2)
35                    Toggle("Show Y axis", isOn: $isShowingYAxis)
36                    Toggle("Show X axis", isOn: $isShowingXAxis)
37                    Toggle("Show heading", isOn: $isShowingHeading)
38                }
39                .padding(.horizontal, 50)
40
41                Spacer()
42            }
43        }
44    }
45}
The header title is set to an empty string as well as the height based on the
isShowingHeading parameter.
 1struct BarChartView: View {
 2    var title: String
 3    var data: [DataItem]
 4    var isShowingYAxis = true
 5    var isShowingXAxis = true
 6    var isShowingHeading = true
 7
 8    var body: some View {
 9        GeometryReader { gr in
10            let axisWidth = gr.size.width * (isShowingYAxis ? 0.15 : 0.0)
11            let axisHeight = gr.size.height * (isShowingXAxis ? 0.1 : 0.0)
12            let headHeight = gr.size.height * (isShowingHeading ? 0.14 : 0.0)
13            let fullChartHeight = gr.size.height - axisHeight - headHeight
14
15            let maxValue = data.map { $0.value }.max()!
16            let tickMarks = AxisParameters.getTicks(top: Int(maxValue))
17            let maxTickHeight = fullChartHeight * 0.95
18            let scaleFactor = maxTickHeight / CGFloat(tickMarks[tickMarks.count-1])
19
20            VStack(spacing:0) {
21                ChartHeaderView(title: isShowingHeading ? title : "")
22                    .frame(height: headHeight)
23                ZStack {
24                    Rectangle()
25                        .fill(Color(#colorLiteral(red: 0.8906477705, green: 0.9005050659, blue: 0.8208766097, alpha: 1)))
26
27                    VStack(spacing:0) {
28                        HStack(spacing:0) {
29                            YaxisView(ticks: tickMarks, scaleFactor: Double(scaleFactor))
30                                .frame(width:axisWidth, height: fullChartHeight)
31                            ChartAreaView(data: data, scaleFactor: Double(scaleFactor))
32                                .frame(height: fullChartHeight)
33                        }
34                        HStack(spacing:0) {
35                            Rectangle()
36                                .fill(Color.clear)
37                                .frame(width:axisWidth, height:axisHeight)
38                            XaxisView(data: data)
39                                .frame(height:axisHeight)
40                        }
41                    }
42                }
43            }
44        }
45    }
46}

Show and hide x and y axes and chart heading
Conclusion
The purpose of a chart is to convey as much information as possible in as simple a format as possible as quickly as possible. Sometimes adding more information such as x and y axes is necessary and other times the extra labels and text can just add clutter. In a previous article, we added the x and y axes to a bar chart in SwiftUI. This article builds on this and adds options to show or hide these axes as well as the option to hide the chart title for the bar chart. There are more changes that could be made to the bar chart and even in hiding the x-axis, there is a question as to whether or not this should hide the line for the x-axis. This code hides the x-axis labels, not the x-axis line, so perhaps this could be an extra configuration to show/hide the x-axis line. In the sample Step Count bar chart, the y-axis does not add much value and could be hidden, but the x-axis shows the days of the week so this chart should show the x-axis and hide the y-axis.