Bar Chart with multiple data sets in SwiftUI
A vertical Bar Chart presents categories of data as bars with the heights proportional to the values they represent. This article shows how to enhance the basic bar chart by displaying data with multiple sets of data for each category. In the bar chart, the bars are grouped into their categories and color is used for the different datasets.
- How to create a Bar Chart in SwiftUI
- Add Axes to a Bar Chart in SwiftUI
- Hide Bar Chart Axes in SwiftUI
- Bar Chart with multiple data sets in SwiftUI
- Horizontal Bar Chart in SwiftUI
Update values to contain an array
Start by updating the definition of the DataItem to hold an array of values for
each item instead of a single value. The variable name is also changed from value to
values as this now contains multiple data points.
1struct DataItem: Identifiable {
2    let name: String
3    let values: [Double]
4    let id = UUID()
5}
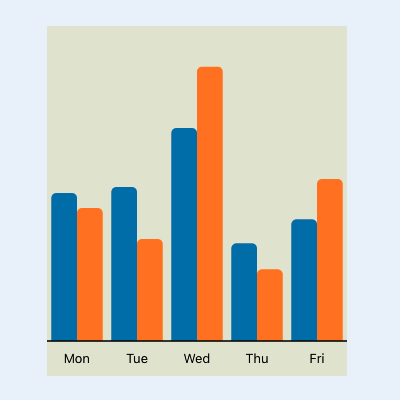
The array of data items is reduced down to 3 items with just two values for each item. This makes it easier to modify the code and evaluate the changes. The data can be scaled up once we have a working bar chart.
1    let chartData: [DataItem] = [
2        DataItem(name: "Mon", values: [890, 800]),
3        DataItem(name: "Tue", values: [657, 900]),
4        DataItem(name: "Wed", values: [1282, 1650])
5    ]
Swift flatmap is used to get the largest value of all the datasets so the y-axis scale factor can be set.
1struct BarChartView: View {
2    ...
3
4            let maxValue = data.flatMap { $0.value }.max()!
5
6    ...
A first step is to just use the first value in the DataItem. This should allow the code to compile and display the same bar chart as before. A higher maximum value is set for one of the second values and the y-axis scale is adjusted to contain this value, even though this bar is not shown.
1struct ChartAreaView: View {
2    ...
3
4                       BarView(
5                            name: item.name,
6                            values: item.value[0],
7                            scaleFactor: scaleFactor)
8
9    ...

Display the second bar
Change the call to BarView back to passing the item values when called from
ChartAreaView.
 1struct ChartAreaView: View {
 2    var data: [DataItem]
 3    var scaleFactor: Double
 4
 5    var body: some View {
 6        ZStack {
 7            RoundedRectangle(cornerRadius: 5.0)
 8                .fill(Color(#colorLiteral(red: 0.8906477705, green: 0.9005050659, blue: 0.8208766097, alpha: 1)))
 9
10            VStack {
11                HStack(spacing:0) {
12                    ForEach(data) { item in
13                        BarView(
14                            name: item.name,
15                            values: item.values,
16                            scaleFactor: scaleFactor)
17                    }
18                }
19            }
20        }
21    }
22}
BarView needs to be updated to receive the values array as the second parameter
rather than a single value. The main change in BarView is to use the list of values
and create a bar for each item in the list. At the moment , there are only two values
so we set the first color to blue and the second color to red. This code creates a
horizontal stack for each BarView with a bar for each value in the values array.
 1struct BarView: View {
 2    var name: String
 3    var values: [Double]
 4    var scaleFactor: Double
 5
 6    var body: some View {
 7        GeometryReader { gr in
 8
 9            let textWidth = gr.size.width * 0.80
10            let padWidth = gr.size.width * 0.05
11            HStack(spacing:0) {
12                Spacer()
13                    .frame(width:padWidth)
14
15                ForEach(values.indices) { i in
16                    let barHeight = values[i] * scaleFactor
17
18                    ZStack {
19                        VStack(spacing:0) {
20                            Spacer()
21                            Rectangle()
22                                .fill((i==0) ? Color.blue : Color.red)
23                                .frame(height: 5.0, alignment: .trailing)
24                        }
25
26                        VStack(spacing:0) {
27                            Spacer()
28                            RoundedRectangle(cornerRadius:5.0)
29                                .fill((i==0) ? Color.blue : Color.red)
30                                .frame(height: CGFloat(barHeight), alignment: .trailing)
31                                .overlay(
32                                    Text("\(values[i], specifier: "%.0F")")
33                                        .font(.footnote)
34                                        .foregroundColor(.white)
35                                        .fontWeight(.bold)
36                                        .frame(width: textWidth)
37                                        .offset(y:10)
38                                    ,
39                                    alignment: .top
40                                )
41                        }
42
43                    }
44                }
45                Spacer()
46                    .frame(width:padWidth)
47            }
48
49        }
50    }
51}

Use a list of colors
An array of colors is defined to address the colors for the bars. This could be extended to multiple sets of colors for different themes. This set of colors is taken from Matplotlib ListedColormap. There are only 10 colors, so the BarColor function is set to wrap around if more than 10 values are present in the dataset.
 1fileprivate var colors:[Color] =
 2    [
 3        Color(red: 0.122, green: 0.467, blue: 0.706),  // #1f77b4
 4        Color(red: 1.000, green: 0.498, blue: 0.055),  // #ff7f0e
 5        Color(red: 0.173, green: 0.627, blue: 0.173),  // #2ca02c
 6        Color(red: 0.839, green: 0.153, blue: 0.157),  // #d62728
 7        Color(red: 0.580, green: 0.404, blue: 0.741),  // #9467bd
 8        Color(red: 0.549, green: 0.337, blue: 0.294),  // #8c564b
 9        Color(red: 0.890, green: 0.467, blue: 0.761),  // #e377c2
10        Color(red: 0.498, green: 0.498, blue: 0.498),  // #7f7f7f
11        Color(red: 0.737, green: 0.741, blue: 0.133),  // #bcbd22
12        Color(red: 0.090, green: 0.745, blue: 0.812)   // #17becf
13    ]
14
15struct ChartColors {
16    static func BarColor(_ colorIndex :Int) -> Color {
17        colors[colorIndex % colors.count]
18    }
19}
More data values are added to each category to see the bars displayed with the different colors.
1    let chartData: [DataItem] = [
2        DataItem(name: "Mon", value: [890, 800, 520, 960]),
3        DataItem(name: "Tue", value: [657, 900, 420, 1180]),
4        DataItem(name: "Wed", value: [1282, 1650, 640, 800])
5    ]
The BarView is updated to use the color index for each value in the values list.
 1struct BarView: View {
 2    ...
 3
 4                ForEach(values.indices) { i in
 5                    let barHeight = values[i] * scaleFactor
 6
 7                    ZStack {
 8                        VStack(spacing:0) {
 9                            Spacer()
10                            Rectangle()
11                                .fill(ChartColors.BarColor(i))
12                                .frame(height: min(5.0, CGFloat(barHeight)), alignment: .trailing)
13                        }
14
15                        VStack(spacing:0) {
16                            Spacer()
17                            RoundedRectangle(cornerRadius:5.0)
18                                .fill(ChartColors.BarColor(i))
19                                .frame(height: CGFloat(barHeight), alignment: .trailing)
20                                .overlay(
21                                    Text("\(values[i], specifier: "%.0F")")
22                                        .font(.footnote)
23                                        .foregroundColor(.white)
24                                        .fontWeight(.bold)
25                                        .frame(width: textWidth)
26                                        .rotationEffect(Angle(degrees: -90))
27                                        .offset(y:15)
28                                    ,
29                                    alignment: .top
30                                )
31                        }
32                    }
33                }
34
35...
36}

Add a key to the bar chart
The chart now displays multiple bars for each category in a different color, but there is no way to tell the viewer what each color represents. This is usually accomplished by displaying a key to the chart. In order to add a key to the bar chart, the data for the keys needs to added to the data. One way to do this is to create a structure that contains the list of keys and the data.
1struct BarChartData {
2    let keys: [String]
3    let data: [DataItem]
4}
The chart data is updated to create an instance of BarChartData with the keys and
the data, such as step count for current and previous week.
 1    let chartData = BarChartData(
 2        keys: ["Previous", "Current"],
 3        data: [
 4            DataItem(name: "Mon", value: [890, 800]),
 5            DataItem(name: "Tue", value: [657, 900]),
 6            DataItem(name: "Wed", value: [1282, 1650]),
 7            DataItem(name: "Thu", value: [285, 637]),
 8            DataItem(name: "Fri", value: [915, 582]),
 9            DataItem(name: "Sat", value: [487, 480]),
10            DataItem(name: "Sun", value: [731, 1173])
11        ])
A new SwiftUI view is created for displaying the key. This will be displayed above
the chart and the layout is handled by the BarChartView. The space for the key is
calculated using GeometryReader and the chart height adjusted to allow for the
key height.
 1struct BarChartView: View {
 2    ...
 3            let keyHeight = gr.size.height * 0.1
 4            let fullChartHeight = gr.size.height - axisHeight - headHeight - keyHeight
 5    ...
 6
 7
 8                    VStack(spacing:0) {
 9                        KeyView(keys: chartData.keys)
10                            .frame(height: keyHeight)
11
12    ...
The KeyView takes the keys array as a parameter and displays a square and the value
of the key in a horizontal stack above the chart.
 1struct KeyView: View {
 2    let keys: [String]
 3
 4    var body: some View {
 5        HStack {
 6            ForEach(keys.indices) { i in
 7                HStack(spacing:0) {
 8
 9                    Image(systemName: "square.fill")
10                        .foregroundColor(ChartColors.BarColor(i))
11
12                    Text("\(keys[i])")
13                }
14                .font(.footnote)
15            }
16        }
17    }
18}

Make key display optional
It makes sense with the rest of the configuration of the bar chart to make the display of the key optional. The main chart view is modified to have a property to store the state of whether the key is displayed on the bar chart as well as a toggle button on the view to change the state.
 1struct ChartView1: View {
 2    @State private var isShowingYAxis = true
 3    @State private var isShowingXAxis = true
 4    @State private var isShowingHeading = true
 5    @State private var isShowingKey = true
 6
 7    let chartData = BarChartData(
 8        keys: ["Previous", "Current"],
 9        data: [
10            DataItem(name: "Mon", values: [890, 800]),
11            DataItem(name: "Tue", values: [657, 900]),
12            DataItem(name: "Wed", values: [1282, 1650]),
13            DataItem(name: "Thu", values: [285, 637]),
14            DataItem(name: "Fri", values: [915, 582]),
15            DataItem(name: "Sat", values: [487, 480]),
16            DataItem(name: "Sun", values: [731, 1173])
17        ])
18
19    var body: some View {
20        VStack {
21            VStack {
22                Spacer()
23                    .frame(height:20)
24
25                BarChartView(
26                    title: "Daily step count",
27                    chartData: chartData,
28                    isShowingYAxis: isShowingYAxis,
29                    isShowingXAxis: isShowingXAxis,
30                    isShowingHeading: isShowingHeading,
31                    isShowingKey: isShowingKey)
32                    .animation(.default)
33                    .frame(width: 400, height: 350, alignment: .center)
34
35                Spacer()
36                    .frame(height:50)
37
38                VStack {
39                    Text("Chart Settings")
40                        .font(.title2)
41                    Toggle("Show Y axis", isOn: $isShowingYAxis)
42                    Toggle("Show X axis", isOn: $isShowingXAxis)
43                    Toggle("Show heading", isOn: $isShowingHeading)
44                    Toggle("Show Key", isOn: $isShowingKey)
45                }
46                .padding(.horizontal, 50)
47
48                Spacer()
49            }
50        }
51    }
52}
The isShowingKey state is passed to the BarChartView and used to determine the
height for the KeyView.
 1struct BarChartView: View {
 2    var title: String
 3    var chartData: BarChartData
 4    var isShowingYAxis = true
 5    var isShowingXAxis = true
 6    var isShowingHeading = true
 7    var isShowingKey = true
 8
 9    var body: some View {
10        let data = chartData.data
11        GeometryReader { gr in
12            let axisWidth = gr.size.width * (isShowingYAxis ? 0.15 : 0.0)
13            let axisHeight = gr.size.height * (isShowingXAxis ? 0.1 : 0.0)
14            let keyHeight = gr.size.height * (isShowingKey ? 0.1 : 0.0)
15            let headHeight = gr.size.height * (isShowingHeading ? 0.14 : 0.0)
16            let fullChartHeight = gr.size.height - axisHeight - headHeight - keyHeight
17
18            let maxValue = data.flatMap { $0.values }.max()!
19            let tickMarks = AxisParameters.getTicks(top: Int(maxValue))
20            let maxTickHeight = fullChartHeight * 0.95
21            let scaleFactor = maxTickHeight / CGFloat(tickMarks[tickMarks.count-1])
22
23            VStack(spacing:0) {
24                ChartHeaderView(title: isShowingHeading ? title : "")
25                    .frame(height: headHeight)
26                ZStack {
27                    Rectangle()
28                        .fill(Color(#colorLiteral(red: 0.8906477705, green: 0.9005050659, blue: 0.8208766097, alpha: 1)))
29
30                    VStack(spacing:0) {
31                        KeyView(keys: chartData.keys, isShowingKey: isShowingKey)
32                            .frame(height: keyHeight)
33
34                        HStack(spacing:0) {
35                            YaxisView(ticks: tickMarks, scaleFactor: Double(scaleFactor))
36                                .frame(width:axisWidth, height: fullChartHeight)
37                            ChartAreaView(data: data, scaleFactor: Double(scaleFactor))
38                                .frame(height: fullChartHeight)
39                        }
40                        HStack(spacing:0) {
41                            Rectangle()
42                                .fill(Color.clear)
43                                .frame(width:axisWidth, height:axisHeight)
44                            XaxisView(data: data)
45                                .frame(height:axisHeight)
46                        }
47                    }
48                }
49            }
50        }
51    }
52}
Finally, the KeyView is updated to only create the views for the keys if the chart
is set to show the keys.
 1struct KeyView: View {
 2    let keys: [String]
 3    let isShowingKey: Bool
 4
 5    var body: some View {
 6        HStack {
 7            if (isShowingKey)
 8            {
 9                ForEach(keys.indices) { i in
10                    HStack(spacing:0) {
11
12                        Image(systemName: "square.fill")
13                            .foregroundColor(ChartColors.BarColor(i))
14
15                        Text("\(keys[i])")
16                    }
17                    .font(.footnote)
18                }
19            }
20        }
21    }
22}


Show and hide the key on the bar chart
Conclusion
This article is part four of creating a Bar Chart in SwiftUI. Is describes how to show multiple sets of data on one bar chart. It is necessary to display the different values for each category in some way, and color is used. This leads to the issue of not knowing what the colors represent, so a key is added to the bar chart. This is then made configurable to show or hide the key on the chart.
There are still some limitations on this code, such there is no code to handle displaying very long strings in the keys or displaying a large number of values for each category. There is code to wrap around the colors after ten, but no code was written to handle displaying the keys for numerous values. I believe that multiple sets of data in a bar chart can be confusing and having more than two or three is not recommended and perhaps a better data visualization should be sought.
The good thing is that the handling of multiple values is largely handles in the
BarView view and the remaining functionality such as showing and hiding the axes
and heading works seamlessly. The labels on the bars was rotated as the bars narrowed
and this could also be a candidate for further customization.
Update - [2021-08-24]
It occurred to me after I published, that there is a better way to hide each of the
views by enclosing the view in an if statement - seems obvious in hindsight! This has
the added benefit of not wasting resources creating views that are not visible. I
placed all of the updated code in one ContentView file that is available in gist
file for the bar chart SwiftUI code. The main change is to BarChartView and the
KeyView does not need to know if it is been shown or not, it is only created when
it is shown.
 1struct BarChartView: View {
 2    ...
 3                if isShowingHeading {
 4                    ChartHeaderView(title: title)
 5                        .frame(height: headHeight)
 6                }
 7    ...
 8
 9                        if isShowingKey {
10                            KeyView(keys: chartData.keys)
11                                .frame(height: keyHeight)
12                        }
13    ...
14                            if isShowingYAxis {
15                                YaxisView(ticks: tickMarks, scaleFactor: Double(scaleFactor))
16                                    .frame(width:axisWidth, height: fullChartHeight)
17                            }
18    ...
19                            if isShowingXAxis {
20                                XaxisView(data: data)
21                                    .frame(height:axisHeight)
22                            }
23    ...
24}