Countries with highest deaths from covid
A lot of time was spent in 2020 looking at daily covid numbers, which was getting overwhelming. Having taken a break for a while, this article combines covid data and vaccination data with population data to present a view of the countries with the highest deaths from Covid-19 and the vaccination status in the country.
The Jupyter notebook is available on Github Countries-with-highest-deaths-from-covid-19-COVID-19 and it can be launched in a browser using Binder with this link Binder - Countries with highest deaths from COVID-19.
Load Covid data
As shown previously in Countries with highest confirmed cases of Covid-19 with Plotly the data is available from Johns Hopkins University who have made the data available on GitHub. More information about COVID-19 and the coronavirus is available from Coronavirus disease (COVID-19) advice for the public.
The latest data on deaths from Covid-19 is loaded directly from github.
 1# Number of Death Cases - Global: time series data for deaths
 2deaths_path = 'https://raw.githubusercontent.com/CSSEGISandData/COVID-19/master/csse_covid_19_data/csse_covid_19_time_series/time_series_covid19_deaths_global.csv'
 3
 4deaths_17_df = pd.read_csv(deaths_path, usecols=['Country/Region', '12/17/21'])
 5deaths_17_df = deaths_17_df.groupby("Country/Region").sum()
 6deaths_17_df.rename_axis(None, axis=0, inplace=True)
 7deaths_17_df
 8
 9"""
10                     12/17/21
11Afghanistan              7332
12Albania                  3158
13Algeria                  6175
14Andorra                   134
15Angola                   1738
16Antigua and Barbuda       117
17Argentina              116892
18Armenia                  7885
19Australia                2142
20Austria                 13438
21"""
 1Top_10 = deaths_17_df.sort_values(by = deaths_17_df.columns[-1], ascending = False).head(10)
 2Top_10
 3
 4"""
 5                12/17/21
 6US                805823
 7Brazil            617395
 8India             476869
 9Mexico            297356
10Russia            289292
11Peru              202076
12United Kingdom    147509
13Indonesia         143986
14Italy             135421
15Iran              130992
16"""
 1bg_color = 'rgba(208,225,242,1.0)'
 2latest_date = pd.to_datetime(deaths_17_df.columns[0])
 3
 4fig = go.Figure(
 5    data = [go.Bar(x = list(Top_10.iloc[:, 0]),
 6                   y = list(Top_10.index),
 7                   hovertemplate = "%{y}: <br>Deaths: %{x:,}<extra></extra>",
 8                   orientation = "h")]
 9)
10
11fig.update_layout(
12    # Set default font
13        font = dict(
14        family = "Droid Sans",
15        size = 14
16    ),
17    # Set figure title
18    title = dict(
19        text = f"<b>Countries with highest deaths from Covid [{latest_date.strftime('%b %d, %Y')}]</b>",
20        xref = 'container',
21        yref = 'container',
22        x = 0.5,
23        y = 0.87,
24        xanchor = 'center',
25        yanchor = 'middle',
26        font = dict(family = 'Droid Sans', size = 24)
27    ),
28    # set the plot bacground color
29    plot_bgcolor = bg_color,
30    # set the hover background color
31    hoverlabel = dict(
32        bgcolor = 'rgba(75,152,201,0.2)',
33        font_size = 16
34    ),
35    paper_bgcolor = bg_color,
36)
37
38fig.update_traces(marker_color = 'rgb(75,152,201)')
39fig['layout']['yaxis']['autorange'] = "reversed"
40fig.show()
Countries with highest deaths from COVID-19
Load Vaccination data
Covid-19 vaccination data is also available publicly on Github at COVID-19 data.
 1# Number of Vaccines - Global: time series data for deaths
 2vaccines_path = "https://raw.githubusercontent.com/govex/COVID-19/master/data_tables/vaccine_data/global_data/time_series_covid19_vaccine_global.csv"
 3vaccines_df = pd.read_csv(vaccines_path)
 4
 5print(f"Shape of vaccines = {vaccines_df.shape}")
 6"""
 7Shape of vaccines = (129128, 8)
 8"""
 9
10print(vaccines_df.iloc[[0,1,2,-3,-2,-1], :])
11"""
12       Country_Region        Date  Doses_admin  People_partially_vaccinated   People_fully_vaccinated Report_Date_String    UID Province_State
130              Canada  2020-12-14          5.0                          0.0                       0.0         2020-12-14  124.0            NaN
141               World  2020-12-14          5.0                          0.0                       0.0         2020-12-14    NaN            NaN
152              Canada  2020-12-15        723.0                          0.0                       0.0         2020-12-15  124.0            NaN
16129125          Yemen  2021-12-17     786027.0                     556652.0                  366587.0         2021-12-18  887.0            NaN
17129126         Zambia  2021-12-17    1342989.0                     806611.0                  904201.0         2021-12-18  894.0            NaN
18129127       Zimbabwe  2021-12-17    7058474.0                    4023289.0                 3035185.0         2021-12-18  716.0            NaN
19"""
Look at vaccinations for a single Country in the most recent dates.
 1vaccines_df[vaccines_df['Country_Region'] == 'Mexico'].tail(10)
 2"""
 3
 4       Country_Region        Date  Doses_admin  People_partially_vaccinated  People_fully_vaccinated Report_Date_String    UID Province_State
 5123215         Mexico  2021-12-08  134370326.0                   78816099.0               65543077.0         2021-12-09  484.0            NaN
 6123849         Mexico  2021-12-09  135022230.0                   78816099.0               65543077.0         2021-12-10  484.0            NaN
 7124483         Mexico  2021-12-10  135481459.0                   78816099.0               65543077.0         2021-12-11  484.0            NaN
 8125117         Mexico  2021-12-11  136829147.0                   80191983.0               66003384.0         2021-12-12  484.0            NaN
 9125751         Mexico  2021-12-12  137169511.0                   80388496.0               66150375.0         2021-12-13  484.0            NaN
10126385         Mexico  2021-12-13  137357032.0                   80503005.0               66225140.0         2021-12-14  484.0            NaN
11127019         Mexico  2021-12-14  137357032.0                   80503005.0               66225140.0         2021-12-15  484.0            NaN
12127651         Mexico  2021-12-15  137357032.0                   81770394.0               66459570.0         2021-12-16  484.0            NaN
13128283         Mexico  2021-12-16  139820373.0                   81770394.0               66459570.0         2021-12-17  484.0            NaN
14128915         Mexico  2021-12-17  139820373.0                   81785946.0               66586509.0         2021-12-18  484.0            NaN
15"""
Look at vaccinations for a single date.
 1vac_17_df = vaccines_df[vaccines_df['Date'] == '2021-12-17']
 2print(vac_17_df.iloc[[0,1,2,4,-4,-3,-2,-1], :])
 3
 4"""
 5       Country_Region        Date   Doses_admin  People_partially_vaccinated  People_fully_vaccinated Report_Date_String    UID Province_State
 6128496    Afghanistan  2021-12-17  5.228706e+06                 4.397449e+06             3.566192e+06         2021-12-18    4.0            NaN
 7128497        Albania  2021-12-17  2.226267e+06                 1.111494e+06             1.001189e+06         2021-12-18    8.0            NaN
 8128498        Algeria  2021-12-17  1.229306e+07                 6.875003e+06             5.391232e+06         2021-12-18   12.0            NaN
 9128500         Angola  2021-12-17  1.080528e+07                 7.246240e+06             3.559041e+06         2021-12-18   24.0            NaN
10129124          World  2021-12-17  8.647128e+09                 4.402818e+09             3.622553e+09         2021-12-18    NaN            NaN
11129125          Yemen  2021-12-17  7.860270e+05                 5.566520e+05             3.665870e+05         2021-12-18  887.0            NaN
12129126         Zambia  2021-12-17  1.342989e+06                 8.066110e+05             9.042010e+05         2021-12-18  894.0            NaN
13129127       Zimbabwe  2021-12-17  7.058474e+06                 4.023289e+06             3.035185e+06         2021-12-18  716.0            NaN
14"""
 1fully_vac_17_df = vac_17_df.groupby("Country_Region").sum()[['People_fully_vaccinated']]
 2fully_vac_17_df.rename_axis(None, axis=0, inplace=True)
 3fully_vac_17_df.drop(['World', 'US (Aggregate)'], axis=0, inplace=True)
 4
 5top_10_vac = fully_vac_17_df.sort_values(by = fully_vac_17_df.columns[-1], ascending = False).head(10)
 6top_10_vac
 7
 8"""
 9           People_fully_vaccinated
10China                 1.162488e+09
11India                 5.330402e+08
12US                    2.034792e+08
13Brazil                1.411751e+08
14Indonesia             1.052381e+08
15Japan                 9.822253e+07
16Mexico                6.658651e+07
17Russia                6.207541e+07
18Pakistan              5.936147e+07
19Germany               5.817144e+07
20"""
Countries with highest vaccinations against COVID-19
Load population data
As detailed in Display COVID-19 numbers relative to population the population data is available from the World Bank data. This is available to download in csv, xml or Excel format. The Excel file contains three worksheets with the population data in the first sheet Data.
Access the excel file to determine the sheet names in the file.
1pop_excel_link = "https://api.worldbank.org/v2/en/indicator/SP.POP.TOTL?downloadformat=excel"
2
3pop_xl = pd.ExcelFile(pop_excel_link, engine = "xlrd")
4print(f"Worksheets = {pop_xl.sheet_names}")  # see all sheet names
5
6"""
7Worksheets = ['Data', 'Metadata - Countries', 'Metadata - Indicators']
8"""
The first sheet *Data* contains the population information.
 1# Load the excel worksheet into a dataframe
 2pop_df = pd.read_excel(
 3    pop_excel_link,
 4    engine = "xlrd",
 5    sheet_name = 'Data',
 6    header = 3)
 7
 8print(pop_df.shape)
 9"""
10(266, 65)
11"""
12
13print(pop_df.iloc[[0,1,2,-3,-2,-1], [0,1,2,-3,-2,-1]])
14"""
15                    Country Name Country Code     Indicator Name         2018         2019         2020
160                          Aruba          ABW  Population, total     105846.0     106310.0     106766.0
171    Africa Eastern and Southern          AFE  Population, total  643090131.0  660046272.0  677243299.0
182                    Afghanistan          AFG  Population, total   37171922.0   38041757.0   38928341.0
19263                 South Africa          ZAF  Population, total   57792520.0   58558267.0   59308690.0
20264                       Zambia          ZMB  Population, total   17351714.0   17861034.0   18383956.0
21265                     Zimbabwe          ZWE  Population, total   14438812.0   14645473.0   14862927.0
22"""
This can be simplified to just read in the last column as we are interested in the latest population.
 1# Load only the desired columns from the excel worksheet into a dataframe
 2pop_2020_df = pd.read_excel(
 3    pop_excel_link,
 4    engine = "xlrd",
 5    sheet_name = 'Data',
 6    usecols = ['Country Name', 'Country Code', '2019'],
 7    header = 3)
 8
 9pop_2020_df.set_index('Country Name', inplace=True)
10pop_2020_df.rename_axis(None, axis=0, inplace=True)
11print(pop_2020_df.shape)
12"""
13(266, 2)
14"""
15
16print(pop_2020_df.iloc[[0,1,2,3,4,5,-5,-4,-3,-2,-1], :])
17"""
18                            Country Code         2019
19Aruba                                ABW     106310.0
20Africa Eastern and Southern          AFE  660046272.0
21Afghanistan                          AFG   38041757.0
22Africa Western and Central           AFW  446911598.0
23Angola                               AGO   31825299.0
24Albania                              ALB    2854191.0
25Kosovo                               XKX    1788878.0
26Yemen, Rep.                          YEM   29161922.0
27South Africa                         ZAF   58558267.0
28Zambia                               ZMB   17861034.0
29Zimbabwe                             ZWE   14645473.0
30"""
There are a number of regions that are aggregate of other countries. These are removed using the data in the second sheet in the excel file (Metadata - Countries).
 1# Need to remove regions that are not countries
 2metadata_df = pd.read_excel(
 3    pop_excel_link,
 4    engine = "xlrd",
 5    sheet_name = 'Metadata - Countries',
 6    header = 0)
 7
 8# metadata_df.isnan('Region')
 9non_country_regions = list(metadata_df[metadata_df['Region'].isna()]['Country Code'])
10print(non_country_regions)
11
12"""
13['AFE', 'AFW', 'ARB', 'CEB', 'CSS', 'EAP', 'EAR', 'EAS', 'ECA', 'ECS', 'EMU', 'EUU', 'FCS', 'HIC', 'HPC', 'IBD', 'IBT', 'IDA', 'IDB', 'IDX', 'LAC', 'LCN', 'LDC', 'LIC', 'LMC', 'LMY', 'LTE', 'MEA', 'MIC', 'MNA', 'NAC', 'OED', 'OSS', 'PRE', 'PSS', 'PST', 'SAS', 'SSA', 'SSF', 'SST', 'TEA', 'TEC', 'TLA', 'TMN', 'TSA', 'TSS', 'UMC', 'WLD']
14"""
These are the top country populations in the world in 2020.
 1# Remove non-countries from the dataframe
 2pop_2020_df = pop_2020_df[~pop_2020_df['Country Code'].isin(non_country_regions)].copy()
 3top_10_pop = pop_2020_df.sort_values(by = pop_2020_df.columns[-1], ascending = False).head(10)
 4
 5print(top_10_pop)
 6"""
 7                   Country Code          2020
 8China                       CHN  1.410929e+09
 9India                       IND  1.380004e+09
10United States               USA  3.294841e+08
11Indonesia                   IDN  2.735236e+08
12Pakistan                    PAK  2.208923e+08
13Brazil                      BRA  2.125594e+08
14Nigeria                     NGA  2.061396e+08
15Bangladesh                  BGD  1.646894e+08
16Russian Federation          RUS  1.441041e+08
17Mexico                      MEX  1.289328e+08
18"""
Top 10 countries by population
Compare countries in the datasets
There are some discrepancies in the countries between the datasets.
 1def extra_countries(df1, df2):
 2    unmatched_covid_countries = sorted(
 3        list(
 4            df1[
 5                ~df1.index
 6                .isin(list(df2.index))
 7            ].index))
 8    return unmatched_covid_countries
 9
10
11def print_list(data, columns=3):
12    # Pretty display for the list of countries
13    for i, x in enumerate(data):
14        print(f"{x.ljust(38, ' ')}", end='')
15        if i%columns==(columns-1):
16            print()
 1extra = extra_countries(deaths_17_df, pop_2020_df)
 2print_list(extra)
 3
 4"""
 5Bahamas                               Brunei                                Burma
 6Congo (Brazzaville)                   Congo (Kinshasa)                      Czechia
 7Diamond Princess                      Egypt                                 Gambia
 8Holy See                              Iran                                  Korea, South
 9Kyrgyzstan                            Laos                                  MS Zaandam
10Micronesia                            Russia                                Saint Kitts and Nevis
11Saint Lucia                           Saint Vincent and the Grenadines      Slovakia
12Summer Olympics 2020                  Syria                                 Taiwan*
13US                                    Venezuela                             Yemen
14"""
 1extra = extra_countries(pop_2020_df, deaths_17_df)
 2print_list(extra)
 3
 4"""
 5American Samoa                        Aruba                                 Bahamas, The
 6Bermuda                               British Virgin Islands                Brunei Darussalam
 7Cayman Islands                        Channel Islands                       Congo, Dem. Rep.
 8Congo, Rep.                           Curacao                               Czech Republic
 9Egypt, Arab Rep.                      Faroe Islands                         French Polynesia
10Gambia, The                           Gibraltar                             Greenland
11Guam                                  Hong Kong SAR, China                  Iran, Islamic Rep.
12Isle of Man                           Korea, Dem. People's Rep.             Korea, Rep.
13Kyrgyz Republic                       Lao PDR                               Macao SAR, China
14Micronesia, Fed. Sts.                 Myanmar                               Nauru
15New Caledonia                         Northern Mariana Islands              Not classified
16Puerto Rico                           Russian Federation                    Sint Maarten (Dutch part)
17Slovak Republic                       St. Kitts and Nevis                   St. Lucia
18St. Martin (French part)              St. Vincent and the Grenadines        Syrian Arab Republic
19Turkmenistan                          Turks and Caicos Islands              Tuvalu
20United States                         Venezuela, RB                         Virgin Islands (U.S.)
21Yemen, Rep.
22"""
1extra = extra_countries(deaths_17_df, fully_vac_17_df)
2print_list(extra)
3
4"""
5Diamond Princess                      Eritrea                               Holy See
6MS Zaandam                            Summer Olympics 2020                  Tonga
7"""
1extra = extra_countries(fully_vac_17_df, deaths_17_df)
2print_list(extra)
3"""
4empty list
5"""
 1extra = extra_countries(fully_vac_17_df, pop_2020_df)
 2print_list(extra)
 3
 4"""
 5Bahamas                               Brunei                                Burma
 6Congo (Brazzaville)                   Congo (Kinshasa)                      Czechia
 7Egypt                                 Gambia                                Iran
 8Korea, South                          Kyrgyzstan                            Laos
 9Micronesia                            Russia                                Saint Kitts and Nevis
10Saint Lucia                           Saint Vincent and the Grenadines      Slovakia
11Syria                                 Taiwan*                               US
12Venezuela                             Yemen
13"""
 1extra = extra_countries(pop_2020_df, fully_vac_17_df)
 2print_list(extra)
 3
 4"""
 5American Samoa                        Aruba                                 Bahamas, The
 6Bermuda                               British Virgin Islands                Brunei Darussalam
 7Cayman Islands                        Channel Islands                       Congo, Dem. Rep.
 8Congo, Rep.                           Curacao                               Czech Republic
 9Egypt, Arab Rep.                      Eritrea                               Faroe Islands
10French Polynesia                      Gambia, The                           Gibraltar
11Greenland                             Guam                                  Hong Kong SAR, China
12Iran, Islamic Rep.                    Isle of Man                           Korea, Dem. People's Rep.
13Korea, Rep.                           Kyrgyz Republic                       Lao PDR
14Macao SAR, China                      Micronesia, Fed. Sts.                 Myanmar
15Nauru                                 New Caledonia                         Northern Mariana Islands
16Not classified                        Puerto Rico                           Russian Federation
17Sint Maarten (Dutch part)             Slovak Republic                       St. Kitts and Nevis
18St. Lucia                             St. Martin (French part)              St. Vincent and the Grenadines
19Syrian Arab Republic                  Tonga                                 Turkmenistan
20Turks and Caicos Islands              Tuvalu                                United States
21Venezuela, RB                         Virgin Islands (U.S.)                 Yemen, Rep.
22"""
Create a mapping between the country names in the datasets.
 1unmatched_covid_countries = extra_countries(deaths_17_df, pop_2020_df)
 2
 3# remove cruise ships and disputed teritories that don't have any equivalent country in population dataset
 4unmatched_covid_countries.remove('Diamond Princess')
 5unmatched_covid_countries.remove('MS Zaandam')
 6unmatched_covid_countries.remove('Holy See')
 7unmatched_covid_countries.remove('Taiwan*')
 8unmatched_covid_countries.remove('Summer Olympics 2020')
 9
10# Manually map these countries to the country names used in COVID-19 dataset
11map_pop = ['Bahamas, The', 'Brunei Darussalam', 'Myanmar', 'Congo, Rep.', 'Congo, Dem. Rep.',
12           'Czech Republic', 'Egypt, Arab Rep.', 'Gambia, The', 'Iran, Islamic Rep.',
13           'Korea, Rep.', 'Kyrgyz Republic', 'Lao PDR', 'Micronesia, Fed. Sts.',
14           'Russian Federation', 'St. Kitts and Nevis', 'St. Lucia', 'St. Vincent and the Grenadines',
15           'Slovak Republic', 'Syrian Arab Republic', 'United States', 'Venezuela, RB', 'Yemen, Rep.'
16          ]
17
18country_map = {}
19for c,p in zip(unmatched_covid_countries, map_pop):
20    country_map[p] = c
Mapping of mis-matched country names between Covid-data and Population data:
| COVID-19 Country Name | Population Country Name |
|---|---|
| Bahamas | Bahamas, The |
| Brunei | Brunei Darussalam |
| Burma | Myanmar |
| Congo (Brazzaville) | Congo, Rep. |
| Congo (Kinshasa) | Congo, Dem. Rep. |
| Czechia | Czech Republic |
| Egypt | Egypt, Arab Rep. |
| Gambia | Gambia, The |
| Iran | Iran, Islamic Rep. |
| Korea, South | Korea, Rep. |
| Kyrgyzstan | Kyrgyz Republic |
| Laos | Lao PDR |
| Micronesia | Micronesia, Fed. Sts. |
| Russia | Russian Federation |
| Saint Kitts and Nevis | St. Kitts and Nevis |
| Saint Lucia | St. Lucia |
| Saint Vincent and the Grenadines | St. Vincent and the Grenadines |
| Slovakia | Slovak Republic |
| Syria | Syrian Arab Republic |
| US | United States |
| Venezuela | Venezuela, RB |
| Yemen | Yemen, Rep. |
Add a field to the population data to contain the country name.
 1# Add the covid country to the population dataset
 2pop_2020_df['Covid_Country'] = pop_2020_df.apply(
 3    lambda x: country_map[x.name]
 4        if x.name in country_map
 5        else x.name,
 6    axis = 1)
 7
 8print(pop_2020_df.iloc[[1,2,3,4,-4,-3,-2,-1], :])
 9
10"""
11             Country Code        2020 Covid_Country
12Afghanistan           AFG  38928341.0   Afghanistan
13Angola                AGO  32866268.0        Angola
14Albania               ALB   2837743.0       Albania
15Andorra               AND     77265.0       Andorra
16Yemen, Rep.           YEM  29825968.0         Yemen
17South Africa          ZAF  59308690.0  South Africa
18Zambia                ZMB  18383956.0        Zambia
19Zimbabwe              ZWE  14862927.0      Zimbabwe
20"""
Confirm that there are no unmatched countries in the Covid datasets.
 1print(list(deaths_17_df[
 2    ~deaths_17_df.index
 3    .isin(list(pop_2020_df['Covid_Country']))
 4].index))
 5
 6"""
 7['Diamond Princess', 'Holy See', 'MS Zaandam', 'Summer Olympics 2020', 'Taiwan*']
 8"""
 9
10print(list(fully_vac_17_df[
11    ~fully_vac_17_df.index
12    .isin(list(pop_2020_df['Covid_Country']))
13].index))
14
15"""
16['Taiwan*']
17"""
Merge datasets on country
A new dataframe is created with the data for the deaths from covid-19 and the vaccinations as well as the population for each country.
 1covid_pop_df = deaths_17_df.merge(
 2    fully_vac_17_df,
 3    how='left',
 4    left_index = True,
 5    right_on = fully_vac_17_df.index
 6).merge (
 7    pop_2020_df,
 8    how='left',
 9    left_on = covid_df.index,
10    right_on = 'Covid_Country'
11)
12
13covid_pop_df.set_index('key_0', inplace=True)
14covid_pop_df.rename_axis(None, axis=0, inplace=True)
15
16# # Rename column names for deaths and population
17covid_pop_df = covid_pop_df.rename(columns={'12/17/21': 'Deaths'})
18covid_pop_df = covid_pop_df.rename(columns={'2020': 'Population'})
19
20# # Remove unneeded columns
21covid_pop_df.drop(['Country Code', 'Covid_Country'], axis=1, inplace=True)
22
23print(covid_pop_df.iloc[[1,2,3,4,-4,-3,-2,-1], :])
24
25"""
26                    Deaths  People_fully_vaccinated  Population
27Albania               3158                1001189.0   2837743.0
28Algeria               6175                5391232.0  43851043.0
29Andorra                134                  50551.0     77265.0
30Angola                1738                3559041.0  32866268.0
31West Bank and Gaza    4855                      0.0   4803269.0
32Yemen                 1974                 366587.0  29825968.0
33Zambia                3674                 904201.0  18383956.0
34Zimbabwe              4779                3035185.0  14862927.0
35"""
Overview of Countries with highest deaths from covid per capita
The number of people vaccinated is calculated per 1,000 of the population and the number of people died is calculated per 100,000 of the population. The top countries with the highest deaths per capita and those with the highest vaccinations are shown for countries with populations greater than 1 million.
 1covid_pop_df['deaths_100k'] = covid_pop_df.apply(lambda x: (x.Deaths / x.Population) * 100000, axis = 1)
 2
 3covid_pop_df['vac_100'] = covid_pop_df.apply(lambda x: (x.People_fully_vaccinated / x.Population) * 100, axis = 1)
 4
 5print(covid_pop_df.iloc[[1,2,3,4,-4,-3,-2,-1], :])
 6
 7"""
 8                    Deaths  People_fully_vaccinated  Population  deaths_100k    vac_100
 9Albania               3158                1001189.0   2837743.0   111.285624  35.281172
10Algeria               6175                5391232.0  43851043.0    14.081763  12.294421
11Andorra                134                  50551.0     77265.0   173.429108  65.425484
12Angola                1738                3559041.0  32866268.0     5.288097  10.828857
13West Bank and Gaza    4855                      0.0   4803269.0   101.076996   0.000000
14Yemen                 1974                 366587.0  29825968.0     6.618394   1.229087
15Zambia                3674                 904201.0  18383956.0    19.984817   4.918425
16Zimbabwe              4779                3035185.0  14862927.0    32.153828  20.421179
17"""
 1top_10 = (covid_pop_df[covid_pop_df['Population'] > 1000000]
 2          .sort_values(by = ['deaths_100k'], ascending = False)
 3          .head(20))
 4
 5bg_color = 'rgba(208,225,242,1.0)'
 6
 7fig = go.Figure(
 8    data = [go.Bar(x = list(top_10["deaths_100k"]),
 9                   y = list(top_10.index),
10                   hovertemplate = "%{y}: <br>Deaths per 100K: %{x:.0f}<extra></extra>",
11                   orientation = "h")]
12)
13
14fig.update_layout(
15    # Set default font
16        font = dict(
17        family = "Droid Sans",
18        size = 14
19    ),
20    # Set figure title
21    title = dict(
22        text = f"<b>Countries with highest deaths from Covid-19 per 100K of population [Dec 17, 2020]</b>",
23        xref = 'container',
24        yref = 'container',
25        x = 0.5,
26        y = 0.92,
27        xanchor = 'center',
28        yanchor = 'middle',
29        font = dict(family = 'Droid Sans', size = 24)
30    ),
31    # set the plot bacground color
32    plot_bgcolor = bg_color,
33    # set the hover background color
34    hoverlabel = dict(
35        bgcolor = 'rgba(75,152,201,0.2)',
36        font_size = 16
37    ),
38    paper_bgcolor = bg_color,
39)
40
41fig.update_traces(marker_color = 'rgb(75,152,201)')
42fig['layout']['yaxis']['autorange'] = "reversed"
43fig.show()
Countries with highest deaths from Covid-19 per 100K of population
These are the countries with populations over 1 million with the lowest number of deaths from covid-19 per capita.
Countries with lowest deaths from Covid-19 per 100K of population
These are the countries with populations over 1 million with the highest percent of the population vaccinated against covid-19.
Countries with lowest deaths from Covid-19 per 100K of population
Vaccination status in countries with highest deaths
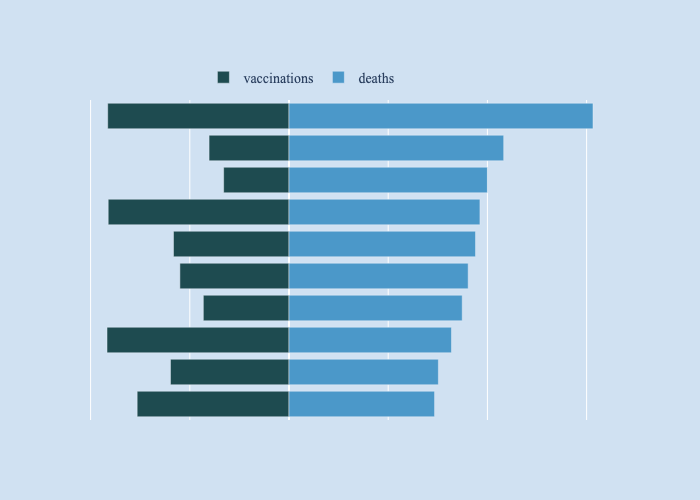
A bar plot in relative mode is used to show percent vaccinated with number of deaths in countries with the highest deaths from cvid-19.
 1top_20 = (covid_pop_df[covid_pop_df['Population'] > 1000000]
 2          .sort_values(by = ['deaths_100k'], ascending = False)
 3          .head(20))
 4
 5neg_vac = [(-1 * x) for x in top_20.vac_100]
 6
 7bg_color = 'rgba(208,225,242,1.0)'
 8
 9fig = go.Figure()
10fig.add_trace(go.Bar(x = [v*6 for v in neg_vac],
11                     y = list(top_20.index),
12                     marker_color = 'rgb(30,75,80)',
13                     name = 'vaccinations',
14                     customdata = [(v * -1) for v in neg_vac],
15                     hovertemplate = "%{y}: <br>Vaccinated: %{customdata:.0f}%<extra></extra>",
16                     orientation = "h"))
17fig.add_trace(go.Bar(x = list(top_20["deaths_100k"]),
18                     y = list(top_20.index),
19                     marker_color = 'rgb(75,152,201)',
20                     name = 'deaths',
21                     hovertemplate = "%{y}: <br>Deaths per 100K: %{x:.0f}<extra></extra>",
22                     orientation = "h"))
23
24
25fig.update_layout(
26    # Set default font
27    font = dict(
28        family = "Droid Sans",
29        size = 14
30    ),
31    # Set figure title
32    title = dict(
33        text = f"<b>Countries with highest deaths from Covid-19 per 100K of population [Dec 17, 2020]</b>",
34        xref = 'container',
35        yref = 'container',
36        x = 0.5,
37        y = 0.95,
38        xanchor = 'center',
39        yanchor = 'middle',
40        font = dict(family = 'Droid Sans', size = 24)
41    ),
42    # set x-axis
43    xaxis = dict(
44        title = '',
45        showticklabels = False,
46    ),
47
48    legend=dict(
49        orientation="h",
50        yanchor="bottom",
51        y=1.02,
52        xanchor="center",
53        x=0.41
54    ),
55
56    # set the plot bacground color
57    plot_bgcolor = bg_color,
58    # set the hover background color
59    hoverlabel = dict(
60        bgcolor = 'rgba(75,152,201,0.2)',
61        font_size = 16
62    ),
63    paper_bgcolor = bg_color,
64)
65
66fig.update_layout(barmode='relative')
67fig['layout']['yaxis']['autorange'] = "reversed"
68fig.show()
Countries with highest deaths from Covid-19 per 100K of population with percentage vaccinated
Conclusion
The covid-19 pandemic is far from over and their continues to be a number of Country status for Covid and Vaccinations. There is a trend that those countries with higher percentage of the population vaccinated have lower deaths per capita, but there are exceptions to this.