Display COVID-19 numbers relative to population
The total number of cases of COVID-19 and deaths from COVID-19 in a country will vary based on a number of factors. It does not seem right to compare absolute numbers in different countries, where the populations of those countries varies greatly. This article will show how to take the absolute numbers and express the confirmed cases and deaths per 100,000 of the population and thus allow comparison between countries.
Data sources:
The data used in this article is retrieved from the Johns Hopkins University who
have made the data available on GitHub. More information about COVID-19 and the
coronavirus is available from Coronavirus disease (COVID-19) advice for the
public.
Population data is obtained from the World Bank data
Load COVID-19 data into dataframes
There are two sets of data to load the global confirmed cases and the global deaths.
- time_series_covid19_deaths_global.csv
- time_series_covid19_confirmed_global.csv
The data can be loaded directly from the GitHub page as in the code below. The data is cleaned to remove unwanted fields and group the data by country with the following function.
 1def load_clean_covid_data(csv_path):
 2    df = pd.read_csv(csv_path)
 3
 4    # 1. Drop unwanted columns
 5    df.drop(['Province/State', 'Lat', 'Long'], axis = 1, inplace = True)
 6
 7    # 2. Group by Country
 8    df = df.groupby('Country/Region').sum()
 9
10    # 3. Convert column headings to datetime
11    df.columns = pd.to_datetime(df.columns)
12
13    # 4. Remove the column name
14    df.rename_axis(None, axis = 0, inplace = True)
15
16    return df
Load the data for Confirmed cases and the data for Deaths from COVID-19 into dataframes.
 1
 2confirmed_df = load_clean_data('https://raw.githubusercontent.com/CSSEGISandData/COVID-19/master/csse_covid_19_data/csse_covid_19_time_series/time_series_covid19_confirmed_global.csv')
 3confirmed_df.shape
 4"""
 5(191, 326)
 6"""
 7
 8confirmed_df.iloc[[0,1,2,-3,-2,-1], [0,1,2,-3,-2,-1]]
 9"""
10             2020-01-22  2020-01-23  2020-01-24  2020-12-10  2020-12-11  2020-12-12
11Afghanistan           0           0           0       48053       48116       48229
12Albania               0           0           0       46061       46863       47742
13Algeria               0           0           0       90579       91121       91638
14Yemen                 0           0           0        2081        2082        2083
15Zambia                0           0           0       18091       18161       18217
16Zimbabwe              0           0           0       11081       11162       11219
17"""
18
19
20deaths_df = load_clean_data('https://raw.githubusercontent.com/CSSEGISandData/COVID-19/master/csse_covid_19_data/csse_covid_19_time_series/time_series_covid19_deaths_global.csv')
21deaths_df.shape
22"""
23(191, 326)
24"""
25
26deaths_df.iloc[[0,1,2,-3,-2,-1], [0,1,2,-3,-2,-1]]
27"""
28             2020-01-22  2020-01-23  2020-01-24  2020-12-10  2020-12-11  2020-12-12
29Afghanistan           0           0           0        1935        1945        1956
30Albania               0           0           0         965         977         989
31Algeria               0           0           0        2564        2575        2584
32Yemen                 0           0           0         606         606         606
33Zambia                0           0           0         364         365         366
34Zimbabwe              0           0           0         305         306         307
35"""
Load global population data into dataframe
World population data is available from the World Bank data. This is available to
download in csv, xml or Excel format. The Excel file contains three worksheets with
the population data in the first sheet Data. This is loaded into a dataframe.
1pop_xl = pd.ExcelFile("/tmp/API_SP.POP.TOTL_DS2_en_excel_v2_1740169.xls", engine = "xlrd")
2pop_xl.sheet_names
3"""
4['Data', 'Metadata - Countries', 'Metadata - Indicators']
5"""
 1# Load the excel worksheet into a dataframe
 2pop_df = pd.read_excel(
 3    "/tmp/API_SP.POP.TOTL_DS2_en_excel_v2_1740169.xls",
 4    engine = "xlrd",
 5    sheet_name = 'Data',
 6    header = 3)
 7
 8pop_df.shape
 9"""
10(264, 65)
11"""
12
13pop_df.iloc[[0,1,2,-3,-2,-1], [0,1,2,-3,-2,-1]]
14"""
15     Country Name Country Code     Indicator Name        2018        2019  2020
160           Aruba          ABW  Population, total    105845.0    106314.0   NaN
171     Afghanistan          AFG  Population, total  37172386.0  38041754.0   NaN
182          Angola          AGO  Population, total  30809762.0  31825295.0   NaN
19261  South Africa          ZAF  Population, total  57779622.0  58558270.0   NaN
20262        Zambia          ZMB  Population, total  17351822.0  17861030.0   NaN
21263      Zimbabwe          ZWE  Population, total  14439018.0  14645468.0   NaN
22"""
Extract population data for 2019 into a dataframe.
 1# Get population for countries for 2019
 2pop_2019_df = pop_df[['Country Name', '2019']].copy()
 3
 4pop_2019_df.shape
 5"""
 6(264, 2)
 7"""
 8
 9pop_2019_df.iloc[[0,1,2,3,4,-5,-4-3,-2,-1], :]
10"""
11    Country Name          2019
120          Aruba  1.063140e+05
131    Afghanistan  3.804175e+07
142         Angola  3.182530e+07
153        Albania  2.854191e+06
164        Andorra  7.714200e+04
17259       Kosovo  1.794248e+06
18257        World  7.673534e+09
19262       Zambia  1.786103e+07
20263     Zimbabwe  1.464547e+07
21"""
Load population data for a single year
After exploring the population dataset, the code above can be simplified to just load
data for a single year. The population data for the year 2019 can be loaded directly
from the Excel file. The Country Code cannot be used, as it is not present in the
COVID-19 data.
 1# Load country and data for 2019 from the excel worksheet into a dataframe
 2pop_2019_df = pd.read_excel(
 3    "/tmp/API_SP.POP.TOTL_DS2_en_excel_v2_1740169.xls",
 4    engine = "xlrd",
 5    sheet_name = 'Data',
 6    usecols = ['Country Name', '2019'],
 7    header = 3)
 8
 9pop_2019_df.shape
10"""
11(264, 2)
12"""
13
14pop_2019_df.iloc[[0,1,2,3,4,-5,-4-3,-2,-1], :]
15"""
16    Country Name          2019
170          Aruba  1.063140e+05
181    Afghanistan  3.804175e+07
192         Angola  3.182530e+07
203        Albania  2.854191e+06
214        Andorra  7.714200e+04
22259       Kosovo  1.794248e+06
23257        World  7.673534e+09
24262       Zambia  1.786103e+07
25263     Zimbabwe  1.464547e+07
26"""
Compare countries in COVID-19 datasets with population dataset
Examine the matching of country names between population data and COVID-19 data as country codes are not used. This shows that there are 25 "Country/Region" that are not present in the population data.
 1# Countries in confirmed_df dataframe that are not in pop_2019_df
 2unmatched_covid_countries = sorted(
 3    list(
 4        confirmed_df[
 5            ~confirmed_df.index
 6            .isin(list(pop_2019_df['Country Name']))
 7        ].index))
 8
 9len(unmatched_covid_countries)
10"""
1125
12"""
13
14unmatched_covid_countries
15"""
16Bahamas                               Brunei                                Burma
17Congo (Brazzaville)                   Congo (Kinshasa)                      Czechia
18Diamond Princess                      Egypt                                 Gambia
19Holy See                              Iran                                  Korea, South
20Kyrgyzstan                            Laos                                  MS Zaandam
21Russia                                Saint Kitts and Nevis                 Saint Lucia
22Saint Vincent and the Grenadines      Slovakia                              Syria
23Taiwan*                               US                                    Venezuela
24Yemen
25"""
Four of these "Country/Region" cannot be mapped to a country in the population data. Two of these are cruise ships, Taiwan* is a disputed territory and the Holy See may be included in smal states. These are removed from the list of unmatched countries.
 1unmatched_covid_countries.remove('Diamond Princess')
 2unmatched_covid_countries.remove('MS Zaandam')
 3unmatched_covid_countries.remove('Holy See')
 4unmatched_covid_countries.remove('Taiwan*')
 5
 6len(unmatched_covid_countries)
 7"""
 821
 9"""
10
11unmatched_covid_countries
12"""
13Bahamas                               Brunei                                Burma
14Congo (Brazzaville)                   Congo (Kinshasa)                      Czechia
15Egypt                                 Gambia                                Iran
16Korea, South                          Kyrgyzstan                            Laos
17Russia                                Saint Kitts and Nevis                 Saint Lucia
18Saint Vincent and the Grenadines      Slovakia                              Syria
19US                                    Venezuela                             Yemen
20"""
The remaining "Country/Region" are manually mapped to Countries in the population dataset.
| COVID-19 Country Name | Population Country Name |
|---|---|
| Bahamas | Bahamas, The |
| Brunei | Brunei Darussalam |
| Burma | Myanmar |
| Congo (Brazzaville) | Congo, Rep. |
| Congo (Kinshasa) | Congo, Dem. Rep. |
| Czechia | Czech Republic |
| Egypt | Egypt, Arab Rep. |
| Gambia | Gambia, The |
| Iran | Iran, Islamic Rep. |
| Korea, South | Korea, Rep. |
| Kyrgyzstan | Kyrgyz Republic |
| Laos | Lao PDR |
| Russia | Russian Federation |
| Saint Kitts and Nevis | St. Kitts and Nevis |
| Saint Lucia | St. Lucia |
| Saint Vincent and the Grenadines | St. Vincent and the Grenadines |
| Slovakia | Slovak Republic |
| Syria | Syrian Arab Republic |
| US | United States |
| Venezuela | Venezuela, RB |
| Yemen | Yemen, Rep. |
Update country names in population dataset
A new column is added to the population dataset to contain the country name from the COVID-19 dataset if it is different or the original country if there is no difference. This could update the country name in place, but it is better to have the two names for verification.
 1map_pop = ['Bahamas, The', 'Brunei Darussalam', 'Myanmar', 'Congo, Rep.', 'Congo, Dem. Rep.',
 2           'Czech Republic', 'Egypt, Arab Rep.', 'Gambia, The', 'Iran, Islamic Rep.',
 3           'Korea, Rep.', 'Kyrgyz Republic', 'Lao PDR', 'Russian Federation', 'St. Kitts and Nevis',
 4           'St. Lucia', 'St. Vincent and the Grenadines', 'Slovak Republic', 'Syrian Arab Republic',
 5           'United States', 'Venezuela, RB', 'Yemen, Rep.'
 6          ]
 7
 8country_map = {}
 9for c,p in zip(unmatched_covid_countries, map_pop):
10    country_map[p] = c
11
12pop_2019_df['Covid_Country'] = pop_2019_df.apply(
13    lambda x: country_map[x['Country Name']]
14        if x['Country Name'] in country_map
15        else x['Country Name'],
16    axis = 1)
17
18pop_2019_df.iloc[[1,2,3,21,29,249], :]
19"""
20          Country Name         2019 Covid_Country
211          Afghanistan   38041754.0   Afghanistan
222               Angola   31825295.0        Angola
233              Albania    2854191.0       Albania
2421        Bahamas, The     389482.0       Bahamas
2529   Brunei Darussalam     433285.0        Brunei
26249      United States  328239523.0            US
27"""
Confirm that there are no unexpected countries in covid data that are not in population data.
 1list(confirmed_df[
 2    ~confirmed_df.index
 3    .isin(list(pop_2019_df['Covid_Country']))
 4].index)
 5"""
 6['Diamond Princess', 'Holy See', 'MS Zaandam', 'Taiwan*']
 7"""
 8
 9list(deaths_df[
10    ~deaths_df.index
11    .isin(list(pop_2019_df['Covid_Country']))
12].index)
13"""
14['Diamond Princess', 'Holy See', 'MS Zaandam', 'Taiwan*']
15"""
Calculate cases and deaths per 100,000 of population
Merge the population numbers for 2019 into the COVID datasets. Rename the column name for 2019 to Population. This is done for the Confirmed cases and the Deaths datasets.
 1# Merge Population data
 2confirmed_pop_df = confirmed_df.merge(
 3    pop_2019_df,
 4    left_index = True,
 5    left_on = confirmed_df.index,
 6    right_on = 'Covid_Country',
 7)
 8
 9# Rename '2019' column name to 'population'
10confirmed_pop_df = confirmed_pop_df.rename(columns={'2019': 'Population'})
11
12confirmed_pop_df.shape
13"""(187, 329)
14"""
15
16confirmed_pop_df.iloc[[0,1,2,-3,-2,-1], [0,1,2,-4,-3,-2,-1]]
17"""
18(187, 329)
19     2020-01-22 00:00:00  2020-01-23 00:00:00  2020-01-24 00:00:00  2020-12-12 00:00:00 Country Name  Population Covid_Country
201                      0                    0                    0                48229  Afghanistan  38041754.0   Afghanistan
213                      0                    0                    0                47742      Albania   2854191.0       Albania
2258                     0                    0                    0                91638      Algeria  43053054.0       Algeria
23260                    0                    0                    0                 2083  Yemen, Rep.  29161922.0         Yemen
24262                    0                    0                    0                18217       Zambia  17861030.0        Zambia
25263                    0                    0                    0                11219     Zimbabwe  14645468.0      Zimbabwe
26"""
 1# Merge Population data
 2deaths_pop_df = deaths_df.merge(
 3    pop_2019_df,
 4    left_index = True,
 5    left_on = deaths_df.index,
 6    right_on = 'Covid_Country',
 7)
 8
 9# Rename '2019' column name to 'population'
10deaths_pop_df = deaths_pop_df.rename(columns={'2019': 'Population'})
11
12deaths_pop_df.shape
13"""(187, 329)
14"""
15
16deaths_pop_df.iloc[[0,1,2,-3,-2,-1], [0,1,2,-4,-3,-2,-1]]
17"""
18     2020-01-22 00:00:00  2020-01-23 00:00:00  2020-01-24 00:00:00  2020-12-12 00:00:00 Country Name  Population Covid_Country
191                      0                    0                    0                 1956  Afghanistan  38041754.0   Afghanistan
203                      0                    0                    0                  989      Albania   2854191.0       Albania
2158                     0                    0                    0                 2584      Algeria  43053054.0       Algeria
22260                    0                    0                    0                  606  Yemen, Rep.  29161922.0         Yemen
23262                    0                    0                    0                  366       Zambia  17861030.0        Zambia
24263                    0                    0                    0                  307     Zimbabwe  14645468.0      Zimbabwe
25"""
To adjust the numbers of confirmed cases and deaths to 100,000 of the population, divide the number by the population and multiply by 100,000.
 1# Confirmed cases per 100,000 of population
 2confirmed_per_100k_df = confirmed_pop_df.copy()
 3col_names = list(confirmed_per_100k_df.columns)
 4[(col_names.remove(x)) for x in ['Country Name', 'Population', 'Covid_Country']]
 5confirmed_per_100k_df[col_names] = (
 6    confirmed_per_100k_df[col_names]
 7    .div(confirmed_per_100k_df['Population'], axis = 0)
 8    .mul(100000, axis = 0)
 9)
10
11confirmed_per_100k_df.shape
12"""
13(187, 329)
14"""
15
16confirmed_per_100k_df.iloc[[0,1,2,-3,-2,-1], [0,50,100,150,-4,-3,-2,-1]]
17"""
18     2020-01-22 00:00:00  2020-03-12 00:00:00  2020-05-01 00:00:00  2020-06-20 00:00:00  2020-12-12 00:00:00 Country Name  Population  Covid_Country
191                    0.0             0.031544             6.022330            74.728416           126.779117  Afghanistan  38041754.0    Afghanistan
203                    0.0             0.805833            27.398307            66.253450          1672.698148      Albania   2854191.0        Albania
2158                   0.0             0.055745             9.648561            27.015505           212.849012      Algeria  43053054.0        Algeria
22260                  0.0             0.000000             0.024004             3.161657             7.142876  Yemen, Rep.  29161922.0          Yemen
23262                  0.0             0.000000             0.610267             8.006257           101.992998       Zambia  17861030.0         Zambia
24263                  0.0             0.000000             0.273122             3.270636            76.603902     Zimbabwe  14645468.0       Zimbabwe
25"""
1# Deaths per 100,000 of population
2deaths_per_100k_df = deaths_pop_df.copy()
3col_names = list(deaths_per_100k_df.columns)
4[(col_names.remove(x)) for x in ['Country Name', 'Population', 'Covid_Country']]
5deaths_per_100k_df[col_names] = (
6    deaths_per_100k_df[col_names]
7    .div(deaths_per_100k_df['Population'], axis = 0)
8    .mul(100000, axis = 0)
9)
Countries with highest confirmed cases per 100,000 of population
Countries with populations of less than one million were removed from the dataset. The data is sorted by the numbers of confirmed cases per 100,000 on the latest date and the data for the top 20 countries displayed in a table and bar chart. The changes over time for the top 10 countries is displayed in a line chart.
 1confirmed_per_100k_df = confirmed_per_100k_df[confirmed_per_100k_df['Population'] > 1000000]
 2
 3top_20_confirmed_df = (confirmed_per_100k_df.sort_values(
 4    by = confirmed_per_100k_df.columns[-4], ascending = False)
 5    .head(20)[['Covid_Country',
 6               'Population',
 7               pd.to_datetime('2020-12-12 00:00:00') ]])
 8
 9# Merge Confirmed data
10top_20_confirmed_df = top_20_confirmed_df.merge(
11    confirmed_df.iloc[:, [-1]],
12    right_index = True,
13    left_on = top_20_confirmed_df['Covid_Country'],
14    right_on = confirmed_df.index,
15)
16
17# Reset the index
18top_20_confirmed_df.reset_index(drop = True, inplace = True)
19
20# Drop the merged key
21top_20_confirmed_df = top_20_confirmed_df.drop(['key_0'], axis = 1)
22
23# Rename the column names
24top_20_confirmed_df = top_20_confirmed_df.rename(
25    columns = {'Covid_Country': 'Country',
26               '2020-12-12 00:00:00_x': 'Cases per 100k',
27               '2020-12-12 00:00:00_y': 'Total cases'})
Table: The top 20 countries with highest cases of COVID-19 on November 12 2020
| Rank | Country | Population | Cases per 100k | Total cases |
|---|---|---|---|---|
| 1 | Bahrain | 1,641,172 | 5,421 | 88,965 |
| 2 | Czechia | 10,669,709 | 5,393 | 575,422 |
| 3 | Belgium | 11,484,055 | 5,252 | 603,159 |
| 4 | Georgia | 3,720,382 | 5,027 | 187,006 |
| 5 | Armenia | 2,957,731 | 4,981 | 147,312 |
| 6 | Qatar | 2,832,067 | 4,973 | 140,827 |
| 7 | US | 328,239,523 | 4,893 | 16,062,299 |
| 8 | Moldova | 2,657,637 | 4,731 | 125,723 |
| 9 | Slovenia | 2,087,946 | 4,573 | 95,481 |
| 10 | Panama | 4,246,439 | 4,488 | 190,585 |
| 11 | Switzerland | 8,574,832 | 4,360 | 373,831 |
| 12 | Croatia | 4,067,500 | 4,241 | 172,523 |
| 13 | Israel | 9,053,300 | 3,930 | 355,786 |
| 14 | Serbia | 6,944,975 | 3,764 | 261,437 |
| 15 | Spain | 47,076,781 | 3,676 | 1,730,575 |
| 16 | Austria | 8,877,067 | 3,603 | 319,822 |
| 17 | France | 67,059,887 | 3,587 | 2,405,255 |
| 18 | Netherlands | 17,332,850 | 3,540 | 613,630 |
| 19 | North Macedonia | 2,083,459 | 3,505 | 73,025 |
| 20 | Kuwait | 4,207,083 | 3,471 | 146,044 |
 1top_10 = top_20_confirmed_df.head(10)
 2bg_color = 'rgba(208, 225, 242, 1.0)'
 3
 4fig = go.Figure(
 5    data = [go.Bar(x = list(top_10['Cases per 100k']),
 6                   y = list(top_10['Country']),
 7                   hovertemplate = [f"""<b>{r['Country']}</b>: Confirmed Cases<br>
 8<br>Per 100k: {r['Cases per 100k']:,.0F}
 9<br>Total: {r['Total cases']:,.0f}
10<br>Population: {r['Population']:,.0f}
11<extra></extra>
12""" for i,r in top_10.iterrows()],
13                   orientation = 'h')]
14)
15
16fig.update_layout(
17    # Set default font
18        font = dict(
19        family = "Droid Sans",
20        size = 16
21    ),
22    # Set figure title
23    title = dict(
24        text = f"""<b>Countries with highest confirmed cases of COVID-19 per 100,000
25<BR>{pd.to_datetime('2020-12-12 00:00:00').strftime('%b %d %Y')}</b>""",
26        xref = 'container',
27        yref = 'container',
28        x = 0.5,
29        y = 0.91,
30        xanchor = 'center',
31        yanchor = 'middle',
32        font = dict(family = 'Droid Sans', size = 24)
33    ),
34    # set x-axis
35    xaxis = dict(
36        title = dict(
37            text = 'Number of confirmed cases per 100,000 of population',
38            font = dict(family = 'Droid Sans', size = 18)
39        ),
40        showgrid = False,
41        linecolor = bg_color,
42        linewidth = 2,
43        showticklabels = True,
44    ),
45    # set y-axis
46    yaxis = dict(
47        showgrid = False,
48        linecolor = bg_color,
49        linewidth = 4,
50    ),
51    # set the plot bacground color
52    plot_bgcolor = bg_color,
53    # set the hover background color
54    hoverlabel = dict(
55        bgcolor = 'rgba(75, 152, 201, 0.2)',
56        font_size = 16
57    ),
58    paper_bgcolor = bg_color,
59)
60
61fig.update_traces(marker_color = 'rgb(75, 152, 201)')
62fig['layout']['yaxis']['autorange'] = "reversed"
63
64fig.show()
Highest confirmed cases of COVID-19 per 100,000 of population
 1top_10_confirmed_df = (confirmed_per_100k_df.sort_values(
 2    by = confirmed_per_100k_df.columns[-4], ascending = False)
 3    .head(10))
 4
 5top_10 = (top_10_confirmed_df
 6          .drop(['Country Name', 'Population'], axis = 1)
 7          .set_index('Covid_Country')
 8          .T)
 9
10bg_color = 'rgba(208, 225, 242, 1.0)'
11line_color = 'rgba(75, 152, 201, 1.0)'
12grid_color = 'rgba(75, 152, 201, 0.3)'
13
14fig = go.Figure()
15for c in top_10.columns:
16    fig.add_trace(go.Scatter(
17        x = top_10.index,
18        y = top_10[c],
19        name = c,
20        hovertemplate = [f"""<b>{c}</b><br>
21<br>Cases per 100k:<br>{r[c]:,.0F}
22<extra></extra>
23""" for i,r in top_10.iterrows()]
24    ))
25
26fig.update_traces(
27     hoverinfo = 'text+name',
28    mode = 'lines'
29)
30
31fig.update_layout(
32    # Set figure title
33    title = dict(
34        text = f"""<b>Highest confirmed cases of COVID-19 per 100,000</b>\
35<br>{top_10.index[-1].strftime('%b %d %Y')}""",
36        xref = 'container',
37        yref = 'container',
38        x = 0.5,
39        y = 0.9,
40        xanchor = 'center',
41        yanchor = 'middle',
42        font = dict(family = 'Droid Sans', size = 28)
43    ),
44    # set legend
45    legend = dict(
46        orientation = 'v',
47        traceorder = 'normal',
48        font_size = 12,
49        x = 0.05,
50        y = 1.0,
51        xanchor = "left",
52        yanchor = "top"
53    ),
54    # set x-axis
55    xaxis = dict(
56        title = 'Date',
57        linecolor = line_color,
58        linewidth = 2,
59        gridcolor = grid_color,
60        showticklabels = True,
61        ticks = 'outside',
62    ),
63    # set y-axis
64    yaxis = dict(
65        title = 'Cases of COVID-19 per 100.000 of population',
66        rangemode = 'tozero',
67        linecolor = line_color,
68        linewidth = 2,
69        gridcolor = grid_color,
70        showticklabels = True,
71        ticks = 'outside',
72    ),
73    # set the plot background color
74    plot_bgcolor = bg_color,
75    paper_bgcolor = bg_color,
76)
77
78fig.show()
Changes in countries with highest confirmed cases of COVID-19 per 100,000 of population
Countries with highest deaths per 100,000 of population
Similar table and charts are created for the Deaths from COVID-19 data.
Table: The top 20 countries with highest deaths per 100,000 from COVID-19 on November 12 2020
| Rank | Country | Population | Deaths per 100k | Total deaths |
|---|---|---|---|---|
| 1 | Belgium | 11,484,055 | 154.9 | 17,792 |
| 2 | Peru | 32,510,453 | 112.4 | 36,544 |
| 3 | Italy | 60,297,396 | 106.2 | 64,036 |
| 4 | Spain | 47,076,781 | 101.2 | 47,624 |
| 5 | North Macedonia | 2,083,459 | 100.6 | 2,096 |
| 6 | Bosnia and Herzegovina | 3,301,000 | 99.9 | 3,298 |
| 7 | Slovenia | 2,087,946 | 97.8 | 2,041 |
| 8 | United Kingdom | 66,834,405 | 95.9 | 64,123 |
| 9 | Moldova | 2,657,637 | 95.8 | 2,547 |
| 10 | US | 328,239,523 | 90.7 | 297,818 |
| 11 | Argentina | 44,938,712 | 90.5 | 40,668 |
| 12 | Mexico | 127,575,529 | 89.1 | 113,704 |
| 13 | Czechia | 10,669,709 | 88.6 | 9,450 |
| 14 | France | 67,059,887 | 86.0 | 57,671 |
| 15 | Brazil | 211,049,527 | 85.8 | 181,123 |
| 16 | Chile | 18,952,038 | 83.6 | 15,846 |
| 17 | Armenia | 2,957,731 | 83.2 | 2,462 |
| 18 | Bulgaria | 6,975,761 | 80.7 | 5,626 |
| 19 | Ecuador | 17,373,662 | 79.9 | 13,874 |
| 20 | Panama | 4,246,439 | 78.4 | 3,331 |
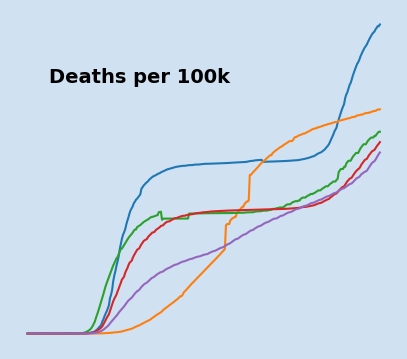
Highest deaths from COVID-19 per 100,000 of population
Changes in countries with highest deaths from COVID-19 per 100,000 of population
Conclusion
Calculations can be applied to a whole dataset easily with Pandas, such as converting
the total numbers of COVID-19 cases to numbers relative to a standard number. The
challenge here was getting the population, which is available from the World Data
Bank, but the names for countries are inconsistent. Once these are mapped to the
countries, the population is merged in for each country. The div and mul
dataframe functions are used to adjust the numbers relative to 100,000 of the
population. The countries with highest relative numbers are not necessarily the same
countries with the highest absolute numbers.
Plotly is an open-source graphing library for Python that produces interactive charts.