Three Dimensional Vectors and Dot Product
The world around is in three dimensions, yet it is not as easy to represent on a 2D surface such as a page or screen. This article, inspired by chapter 3 of Math for Programmers book, looks at presenting 3D vectors with Matplotlib. It also shows how to calculate the length of 3D-vectors and explores the dot product of 3D vectors.
These are my notes on the book Math for Programmers by Paul Orland.
- 2D vectors and vector arithmetic
- Two Dimensional shapes
- Three Dimensional Vectors and Dot Product
3D vectors
A 2D vector can be represented as two Cartesian coordinates x and y. These represent the distance from the origin in the horizontal and vertical axes. If we imagine this 2D plane lying flat on the desk and imagine another axis rising above or below the desk, then the shapes could take on a third dimension. This axis is given the label z-axis as a measure of depth. Three Cartesian coordinates (x, y and z) are used to represent a vector in 3D-space.
 1fig = plt.figure(facecolor=plt.cm.Blues(0.2))
 2ax = fig.gca(projection="3d")
 3fig.suptitle(
 4    f"3D-vector (2,3,4)",
 5    fontsize=18,
 6    fontweight="bold",
 7)
 8
 9xs, ys, zs = zip((2, 3, 4), (0, 0, 0))
10ax.plot(xs, ys, zs, color="blue")
11ax.set_facecolor(plt.cm.Blues(0.2))
12ax.set_xlim(0, 4)
13ax.set_ylim(0, 4)
14ax.set_zlim(0, 4)
15ax.set_xlabel("x-axis")
16ax.set_ylabel("y-axis")
17ax.set_zlabel("z-axis")
18
19plt.show()

3D vector with Matplotlib
Viewing 3D vectors
It can be difficult to visualize 3D vectors and objects as these are still being presented on 2D screens and surfaces. This is the same vector plus a vector lying flat on the XY plane shown from different Viewing angles and viewing elevations. Both of these vectors have (3,4) for their (x,y) coordinates, but the blue one has a z-coordinate of 4, while the red one is flat on the XY plane (as specified with a z-coordinate of zero).
 1fig, axs = plt.subplots(
 2    1, 4, figsize=(12, 4), facecolor=plt.cm.Blues(0.2), subplot_kw={"projection": "3d"}
 3)
 4fig.suptitle(
 5    f"Different 3D viewing angles",
 6    fontsize=22,
 7    fontweight="bold",
 8)
 9
10for i, ax in enumerate(axs.flatten()):
11    ax.set_facecolor(plt.cm.Blues(0.2))
12    xs, ys, zs = zip((0, 0, 0), (3, 4, 4))
13    ax.plot(xs, ys, zs, color="blue")
14    xs, ys, zs = zip((0, 0, 0), (3, 4, 0))
15    ax.plot(xs, ys, zs, color="red")
16    ax.set_xlim(0, 4)
17    ax.set_ylim(0, 4)
18    ax.set_zlim(0, 4)
19    ax.set_xlabel("x-axis")
20    ax.set_ylabel("y-axis")
21    ax.set_zlabel("z-axis")
22
23    view_angle = i * (30)
24    ax.view_init(elev=10.0, azim=view_angle)
25    ax.set_title(f"View Angle = {view_angle}", fontsize=14, pad=5)
26
27fig.tight_layout(pad=2.0)
28plt.show()
29
30publish_png_image(fig, "3d-vector-different-viewing-angles.png")

 1fig, axs = plt.subplots(
 2    1, 4, figsize=(12, 4), facecolor=plt.cm.Blues(0.2), subplot_kw={"projection": "3d"}
 3)
 4fig.suptitle(
 5    f"Increasing viewing elevation",
 6    fontsize=22,
 7    fontweight="bold",
 8)
 9
10for i, ax in enumerate(axs.flatten()):
11    ax.set_facecolor(plt.cm.Blues(0.2))
12    xs, ys, zs = zip((0, 0, 0), (3, 4, 4))
13    ax.plot(xs, ys, zs, color="blue")
14    xs, ys, zs = zip((0, 0, 0), (3, 4, 0))
15    ax.plot(xs, ys, zs, color="red")
16    ax.set_xlim(0, 4)
17    ax.set_ylim(0, 4)
18    ax.set_zlim(0, 4)
19    ax.set_xlabel("x-axis")
20    ax.set_ylabel("y-axis")
21    ax.set_zlabel("z-axis")
22
23    elevation = i * 25.0
24    ax.view_init(elev=elevation)
25    ax.set_title(f"Elevation = {elevation}", fontsize=14, pad=5)
26
27fig.tight_layout(pad=2.0)
28plt.show()

Length of 3D vector
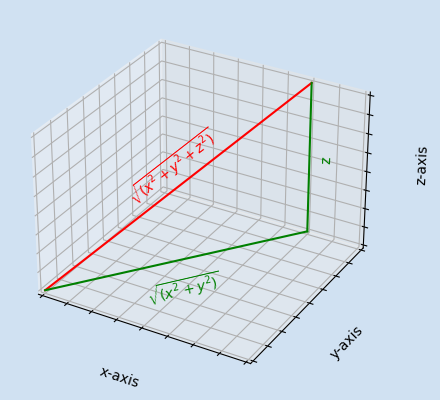
The Pythagorean theorem is used to calculate the length of a vector in 2D-space. This can be extended to create a formula to calculate the length of a three-dimensional vector. The central fact of 3D-space is that the three planes X, Y & Z are perpendicular to each other, so any line on one plane is at right-angles to a line on another plane.
Think of the XY plane as lying flat on a table and the Z dimension as rising vertically up. Any 3D-vector (x,y,z) will have a corresponding 2D vector (x,y) on the XY plane vertically below it. The length of (0,0) to (x,y) can be calculated using Pythagorean theorem. This line is one of The edges of a right-angled triangle with z being the second edge - allowing the calculation of the length of the 3D-vector (x,y,z).
$$ hypotenuse \ of \ xy = \sqrt{(x^2 + y^2)} $$
This hypotenuse on the XY plane is perpendicular to the Z plane so
$$ vector \ length = \sqrt{((hypotenuse \ of \ xy)^2 + z^2)} $$
$$ vector \ length = \sqrt{ \left( \sqrt{(x^2 + y^2)} \right) ^2 + z^2} $$
The inner square root and squared cancel each other out
$$ \left( \sqrt{ (x^2 + y^2)} \right) ^2 = (x^2 + y^2) $$
$$ vector \ length = \sqrt{(x^2 + y^2 + z^2)} $$
 1fig, axs = plt.subplots(
 2    1, 3, figsize=(10, 4), facecolor=plt.cm.Blues(0.2), subplot_kw={"projection": "3d"}
 3)
 4fig.suptitle(
 5    f"Use of Pythagorean theorem to calculate length 3D-vector",
 6    fontsize=18,
 7    fontweight="bold",
 8)
 9
10for i, ax in enumerate(axs.flatten()):
11    ax.set_facecolor(plt.cm.Blues(0.2))
12    xs, ys, zs = zip((0, 0, 0), (3, 4, 4))
13    ax.plot(xs, ys, zs, color="blue")
14    ax.set_xlim(0, 4)
15    ax.set_ylim(0, 4)
16    ax.set_zlim(0, 4)
17    ax.set_xlabel("x-axis")
18    ax.set_ylabel("y-axis")
19    ax.set_zlabel("z-axis")
20
21
22axs[1].plot((0, 3), (0, 0), (0, 0), color="teal")
23axs[1].plot((3, 3), (0, 4), (0, 0), color="teal")
24axs[1].plot((0, 3), (0, 4), (0, 0), color="teal")
25axs[1].text(1.5, 0.2, 0, "x", "x", color="teal")
26axs[1].text(2.5, 1.6, 0, "y", "y", color="teal")
27axs[1].text(0.7, 1.6, 0, r"$\sqrt{(x^2 + y^2)}$", (3, 4, 0), color="teal")
28
29
30axs[2].plot((0, 3), (0, 4), (0, 0), color="red")
31axs[2].plot((3, 3), (4, 4), (0, 4), color="red")
32axs[2].text(1.7, 0.5, 0, r"$\sqrt{(x^2 + y^2)}$", (3, 4, 0), color="red")
33axs[2].text(3.2, 4.0, 2.0, "z", "z", color="red")
34axs[2].text(1, 1, 2, r"$\sqrt{(x^2 + y^2 + z^2)}$", (3, 4, 4), color="blue")
35
36fig.tight_layout(pad=2.0)
37plt.show()

The length of a 3D-vector can be calculated in Python in a similar manner to the
length of a 2D-vector. A list comprehension can be used to create a generic
vector_length function that will work for multiple dimensions. This function can be
used to calculate the length of vectors with dimensions greater than 3.
 1import math as m
 2
 3def vector_2d_length(v):
 4    return m.sqrt(v[0] ** 2 + v[1] ** 2)
 5
 6def vector_3d_length(v):
 7    return m.sqrt(v[0] ** 2 + v[1] ** 2 + v[2] ** 2)
 8
 9def vector_length(v):
10    return m.sqrt(sum((c ** 2) for c in v))
11
12vector_2d_length((3,4))
13"""
145.0
15"""
16
17vector_3d_length((3,4,4))
18"""
196.4031242374328485
20"""
21
22vector_length((3,4))
23"""
245.0
25"""
26
27vector_length((3,4,4))
28"""
296.4031242374328485
30"""
31
32vector_length((3,4,4,4))
33"""
347.54983443527075
35"""
36
37vector_length((3,4,5,6,7,8))
38"""
3914.106735979665885
40"""
Dot product
There are two important mechanisms of multiplying one 3D vector by another; the dot product and the cross product.
The dot product returns a scaler and works on 2D, 3D or higher number of dimensions. The dot product is the sum of the products of the corresponding entries of the two sequences of numbers. The dot product of 2 vectors is a measure of how aligned the vectors are. When vectors are pointing in the same or similar direction, the dot product is positive. When vectors are pointing in opposite direction, the dot product is negative. When two vectors are perpendicular to each other then their dot product is zero regardless of the magnitude of the vectors.
It is very straight forward to calculate the dot product in python. Again, a list comprehension is used to create a generic function that works for vectors with multiple dimensions.
 1def dot(v1, v2):
 2    return sum([c1 * c2 for c1, c2 in zip(v1, v2)])
 3
 4
 5dot((3, 4), (4, 4))
 6dot((4, 4), (-2, 2))
 7dot((-3, -4), (-4, -3))
 8dot((3, 4), (-3, -4))
 9"""
1028
110
1224
13-25
14"""
15
16
17dot((3, 4, 5), (4, 4, 4))
18dot((3, 0, 9), (-6, 4, 2))
19dot((3, -4, -5), (-4, 4, 4))
20"""
2148
220
23-48
24"""
 1def plot_vector(ax, v, c):
 2    ax.annotate(
 3        "",
 4        (v[0], v[1]),
 5        xytext=(0, 0),
 6        arrowprops=dict(ec=c, fc=c, alpha=0.6),
 7    )
 8
 9
10def update_axis(ax, v1, v2):
11    plot_vector(ax, v1, "blue")
12    plot_vector(ax, v2, "red")
13    ax.set_title(f"dot product = {dot(v1, v2)}", fontsize=14)
14
15
16fig, axs = plt.subplots(2, 3, figsize=(12, 8), facecolor=plt.cm.Blues(0.2))
17fig.suptitle(
18    f"dot product",
19    fontsize=22,
20    fontweight="bold",
21)
22
23for i, ax in enumerate(axs.flatten()):
24    ax.set_facecolor(plt.cm.Blues(0.2))
25    ax.spines["right"].set_visible(False)
26    ax.spines["top"].set_visible(False)
27    ax.spines["left"].set_position("zero")
28    ax.spines["bottom"].set_position("zero")
29    ax.set_xlim(-5, 5)
30    ax.set_ylim(-5, 5)
31    ax.set_aspect("equal")
32    ax.grid(True)
33    ax.set_xticks([x for x in range(-4, 5, 1)])
34    ax.set_yticks([x for x in range(-4, 5, 1)])
35
36update_axis(axs[0][0], (3, 4), (4, 4))
37update_axis(axs[0][1], (3, 4), (2, 2))
38update_axis(axs[0][2], (4, 4), (-2, 2))
39update_axis(axs[1][0], (-3, -4), (-4, -4))
40update_axis(axs[1][1], (3, 4), (-4, -3))
41update_axis(axs[1][2], (3, 4), (-3, -4))
42
43fig.tight_layout(pad=2.0)
44plt.show()

 1def plot_axes(ax):
 2    ax.plot((-4, 4), (0, 0), (0, 0), color="grey")
 3    ax.plot((0, 0), (-4, 4), (0, 0), color="grey")
 4    ax.plot((0, 0), (0, 0), (-4, 4), color="grey")
 5
 6
 7def plot_vector(ax, v, c):
 8    ax.plot((0, v[0]), (0, v[1]), (0, v[2]), color=c)
 9
10
11def update_axis(ax, v1, v2):
12    plot_axes(ax)
13    plot_vector(ax, v1, "blue")
14    plot_vector(ax, v2, "red")
15    ax.set_title(f"dot product = {dot(v1, v2)}", fontsize=14)
16
17
18fig, axs = plt.subplots(
19    2, 3, figsize=(10, 8), facecolor=plt.cm.Blues(0.2), subplot_kw={"projection": "3d"}
20)
21fig.suptitle(
22    f"dot product on 3D-vector",
23    fontsize=18,
24    fontweight="bold",
25)
26
27for i, ax in enumerate(axs.flatten()):
28    ax.set_facecolor(plt.cm.Blues(0.1))
29    ax.set_xlim(-7, 5)
30    ax.set_ylim(-5, 5)
31    ax.set_zlim(-6, 10)
32    ax.set_xlabel("x-axis")
33    ax.set_ylabel("y-axis")
34    ax.set_zlabel("z-axis")
35
36update_axis(axs[0][0], (3, 4, 5), (4, 4, 4))
37update_axis(axs[0][1], (3, 0, 9), (-6, 4, 2))
38update_axis(axs[0][2], (3, -4, -5), (-4, 4, 4))
39
40update_axis(axs[1][0], (3, 4, 5), (4, 4, 4))
41axs[1][0].view_init(azim=-80)
42update_axis(axs[1][1], (3, 0, 9), (-6, 4, 2))
43axs[1][1].view_init(azim=-80)
44update_axis(axs[1][2], (3, -4, -5), (-4, 4, 4))
45axs[1][2].view_init(azim=-80)
46
47fig.tight_layout(pad=2.0)
48plt.show()

Use of dot product
Two specific uses of dot product are:
- Angle of a vector
- Length of a vector
Angle
The dot product of two vectors is easy to calculate and can tell if the angle between two vectors is less than, greater than or equal to 90o. More specifically, the dot product of two vectors is equal to the product of their lengths by the cosine of the angle between the vectors.
$$ v1 \cdot v2 = |v1| \cdot |v2| \cdot cos θ $$
$$ v1 \cdot v2 = |v1| \ {\times} \ |v2| \ {\times} \ cos θ $$
It is more common to want to find the angle from given coordinates, so the formula can be rearranged.
$$ cos θ = \frac {v1 \cdot v2}{|v1| \ {\times} \ |v2|} $$
or
$$ θ = arccos \left( \frac {v1 \cdot v2}{|v1| \ {\times} \ |v2|} \right) $$
Example of the angle between (3,4,5) and (4,4,4)
$$ θ = arccos \left( \frac {(3,4,5) \cdot (4,4,4)}{|(3,4,5)| \ {\times} \ |(4,4,4)|} \right) $$
$$ θ = arccos \left( \frac {48}{7.07 \ {\times} \ 6.928} \right) = arccos \left( \frac {48}{48.99} \right) = arccos \left( 0.979 \right) = 0.201 Radians = 11.5^{\circ} $$
This can be written in the following Python function.
 1import math as m
 2
 3
 4def angle_between_vectors(v1, v2):
 5    return m.acos(dot(v1, v2) / (vector_length(v1) * vector_length(v2))) * (180 / m.pi)
 6
 7
 8angle_between_vectors((3, 4, 5), (4, 4, 4))
 9"""
1011.536959032815467
11"""
12
13angle_between_vectors((3, 0, 9), (-6, 4, 2))
14"""
1590.0
16"""
17
18angle_between_vectors((3, -4, -5), (-4, 4, 4))
19"""
20168.46304096718453
21"""
Length
The length of a vector is the square root of the dot product of the vector by itself
$$ vector \ length = |v| = \sqrt{v \cdot v} $$
Vector length of (3,4), (3,4,4) and (3,4,4,4)
$$ vector \ length = \sqrt{v \cdot v} = \sqrt{(3,4) \cdot (3,4))} = \sqrt{25} = 5 $$
$$ vector \ length = \sqrt{v \cdot v} = \sqrt{(3,4,4) \cdot (3,4,4))} = \sqrt{41} = 6.40 $$
$$ vector \ length = \sqrt{v \cdot v} = \sqrt{(3,4,4,4) \cdot (3,4,4,4))} = \sqrt{57} = 7.55 $$
 1import math as m
 2
 3
 4def vector_len_dot(v):
 5    return m.sqrt(dot(v, v))
 6
 7
 8vector_len_dot((3,4))
 9"""
105.0
11"""
12
13vector_len_dot((3,4,5))
14"""
157.0710678118654755
16"""
17
18vector_len_dot((4,4,4))
19"""
206.928203230275509
21"""
22
23vector_len_dot((3,4,4,4))
24"""
257.54983443527075
26"""
Conclusion
This article showed how to display 3D-vectors from different angles and perspectives. Even with this, it can be difficult to visualize 3D vectors and objects as these are still being presented on 2D screens. Two mechanisms were shown of calculating the length of a 3D vector. The dot product was examined and some of its uses such as determining if vectors are perpendicular as well as calculating the exact angle between vectors or calculating the length of a vector using the dot product. Next article will look at the cross product as well as shading and plotting 3D objects.
matplotlib a comprehensive library for creating static, animated, and interactive visualizations in Python.
Math for Programmers by Paul Orland - a great book to brush up on your math skills.