How to create a pie chart in SwiftUI
Pie charts are widely used in the business world and the mass media. There is some criticism of the use of pie charts as it can be difficult to compare sector sizes, however they can be useful when the number of sectors is small. In this article we walk through how to create a pie chart in SwiftUI using path.addArc method. It also shows how to add labels to each sector of the pie chart.
A Pie chart is a circular chart divided into slices to illustrate numerical proportion. The arc length of each slice (and its area) is proportional to the quantity it represents.
Display a piece of pie
SwiftUI framework provides addArc to create a sector of a pie chart. The
following code creates a sector with an angle of 120 degrees. The default location
and direction of the sector may seem incorrect. This is because the default
orientation in SwiftUI is a flipped xy coordinate system with the top left corner
starting at (0, 0). The x coordinate increases moving from left to right and y
increases moving down the screen. The sector shape is centered at (200,200) and the
startAngle set to zero and the endAngle set to 120 degrees. The clockwise
parameter is set to false, yet the sector starts at 3 o'clock and ends at 7 o'clock,
which seems in a clockwise direction. This is because of the flipped y-axis
orientation.
 1struct ArcView: View {
 2    var body: some View {
 3        Path { path in
 4            path.move(to: CGPoint(x: 200, y: 200))
 5            path.addArc(center: .init(x: 200, y: 200),
 6                        radius: 150,
 7                        startAngle: Angle(degrees: 0.0),
 8                        endAngle: Angle(degrees: 120.0),
 9                        clockwise: false
10            )
11        }
12        .fill(Color.purple)
13    }
14}

Display multiple pieces of pie
Multiple sectors can be combined in a ZStack to create a pie chart. The angles are adjusted so that the pie chart starts at 12 o'clock.
 1    var body: some View {
 2        let angleOffset = 90.0
 3        ZStack {
 4            Path { path in
 5                path.move(to: CGPoint(x: 200, y: 200))
 6                path.addArc(center: .init(x: 200, y: 200),
 7                            radius: 150,
 8                            startAngle: Angle(degrees: 0.0 - angleOffset),
 9                            endAngle: Angle(degrees: 160.0 - angleOffset),
10                            clockwise: false
11                )
12            }
13            .fill(Color(red: 126/255, green: 40/255, blue: 80/255))
14
15            Path { path in
16                path.move(to: CGPoint(x: 200, y: 200))
17                path.addArc(center: .init(x: 200, y: 200),
18                            radius: 150,
19                            startAngle: Angle(degrees: 160.0 - angleOffset),
20                            endAngle: Angle(degrees: 280.0 - angleOffset),
21                            clockwise: false
22                )
23            }
24            .fill(Color(red: 37/255, green: 166/255, blue: 188/255))
25
26            Path { path in
27                path.move(to: CGPoint(x: 200, y: 200))
28                path.addArc(center: .init(x: 200, y: 200),
29                            radius: 150,
30                            startAngle: Angle(degrees: 280.0 - angleOffset),
31                            endAngle: Angle(degrees: 360.0 - angleOffset),
32                            clockwise: false
33                )
34            }
35            .fill(Color(red: 49/255, green: 63/255, blue: 95/255))
36        }
37    }

Create sector shape
Let's start by separating the code to create a Sector shape. This takes two parameters for the start angle and the end angle of the sector. It creates a sector shape of a circle that would fit in the containing frame.
 1struct Sector: Shape {
 2    var startAngle: Angle
 3    var endAngle: Angle
 4
 5    func path(in rect: CGRect) -> Path {
 6        // centre of the containing rect
 7        let c = CGPoint(x: rect.width/2.0, y: rect.height/2.0)
 8        // radius of a circle that will fit in the rect
 9        let r = Double(min(rect.width,rect.height)) * 0.9 / 2.0
10        var path = Path()
11        path.move(to: c)
12        path.addArc(center: c,
13                    radius: CGFloat(r),
14                    startAngle: startAngle,
15                    endAngle: endAngle,
16                    clockwise: false
17        )
18        path.closeSubpath()
19        return path
20    }
21}
Show two sample sectors in a ZStack.
 1struct ShowSectorView: View {
 2    var body: some View {
 3        VStack {
 4            ZStack {
 5                Sector(startAngle: Angle(degrees: -65),
 6                       endAngle: Angle(degrees: -15))
 7                    .fill(Color.red)
 8                Sector(startAngle: Angle(degrees: 115),
 9                       endAngle: Angle(degrees: 205))
10                    .fill(Color.green)
11            }
12            .frame(width: 300, height: 300)
13
14            Spacer()
15        }
16    }
17}

Create Pie Chart view using Sector shapes
The Sector shape can be used in the following PieChartView to create a pie chart.
This takes an array of numbers for the values of each of the items in the pie chart.
The sizes passed in are sorted in decreasing order and each size is plotted on the
pie chart relative to the sum of the sizes. The pie chart is set to start at 12
o'clock and move in a clockwise direction from largest to smallest size.
 1struct PieChartView: View {
 2    var sizes:[Double]
 3
 4    let angleOffset = 90.0
 5    let colors = [
 6        Color(red: 126/255, green: 40/255, blue: 80/255),
 7        Color(red: 49/255, green: 63/255, blue: 95/255),
 8        Color(red: 37/255, green: 166/255, blue: 188/255),
 9        Color(red: 130/255, green: 122/255, blue: 162/255),
10        Color(red: 241/255, green: 165/255, blue: 138/255)]
11
12    var body: some View {
13        let total = sizes.reduce(0, +)
14        let angles = sizes.sorted(by: >).map { $0 * 360.0 / total }
15        var sum = 0.0
16        let runningAngles = angles.map { (sum += $0, sum).1 }
17
18        ZStack {
19            ForEach(0..<runningAngles.count) { i in
20                let startAngle = i==0 ? 0.0 : runningAngles[i-1]
21                Sector(
22                    startAngle: Angle(degrees: startAngle - angleOffset),
23                    endAngle: Angle(degrees: runningAngles[i] - angleOffset)
24                )
25                .fill(colors[i % colors.count])
26            }
27        }
28    }
29}
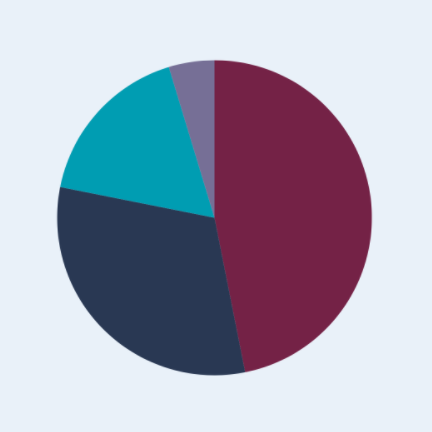
The following code demonstrates a couple of sample pie charts and shows that the pie charts scale to fit into the containing frame.
 1struct ShowPieChartView: View {
 2    var body: some View {
 3        VStack {
 4            PieChartView(sizes: [30.6, 25.5, 13.4])
 5                .frame(width: 300, height: 300)
 6                .padding(30)
 7
 8            HStack {
 9                PieChartView(sizes: [20.0, 5, 15.0, 12, 3])
10                    .frame(width: 100, height: 100)
11                PieChartView(sizes: [1,2,3,4])
12                    .frame(width: 100, height: 100)
13                PieChartView(sizes: [300, 200])
14                    .frame(width: 100, height: 100)
15            }
16
17            Spacer()
18        }
19    }
20}

How many sectors in a pie chart
The number of colors defined for the sectors in the pie chart is limited to five as
there is a limit to how useful pie charts are for a large number of items. Pie charts
do get a bad rap every now and then. I think they can be useful if the items being
compared is limited in number to two or three and there are significant differences
to show. The following image shows that it is not possible to tell when three sectors
are slightly different. Pie charts can be useful to show when one item is dominant
relative to other items. I've included a pie chart with one sector as more of a test
on the PieChartView, but this is a really useless pie chart. To make PieChartView
more robust, guard statements could be added to set constraints on the number of
sectors allowed.
 1struct PieChartsView: View {
 2    var body: some View {
 3        VStack {
 4            HStack {
 5                VStack {
 6                    PieChartView(sizes: [30])
 7                        .frame(width: 280, height: 280)
 8                    Text("One Sector")
 9                }
10                VStack {
11                    PieChartView(sizes: [30, 28])
12                        .frame(width: 280, height: 280)
13                    Text("Two Sectors")
14                }
15                VStack {
16                    PieChartView(sizes: [30, 28, 26])
17                        .frame(width: 280, height: 280)
18                    Text("Three Sectors")
19                }
20            }
21            HStack {
22                VStack {
23                    PieChartView(sizes: [30, 28, 26, 24])
24                        .frame(width: 280, height: 280)
25                    Text("Four Sectors")
26                }
27                VStack {
28                    PieChartView(sizes: [30, 28, 26, 24, 22])
29                        .frame(width: 280, height: 280)
30                    Text("Five Sectors")
31                }
32                VStack {
33                    PieChartView(sizes: [130, 28, 100, 24, 22])
34                        .frame(width: 280, height: 280)
35                    Text("Five Sectors")
36                }
37            }
38            Spacer()
39        }
40        .font(.title)
41    }
42}

Pie charts are more useful when the number of sectors is two or three
Sector with Label
Create a SectorView to contain a sector and a label. This will allow the creation
of a pie chart with labels on each section, which will help clarify when sectors are
similar sizes. A number of new parameters are required by the view to specify the
sector color as well value and offset for the label.
 1struct SectorView: View {
 2    var startAngle: Angle
 3    var endAngle: Angle
 4    var value: Double
 5    var color: Color
 6    var labelOffset: Double
 7    var labelSize: Double = 20.0
 8
 9    var labelPoint: CGPoint {
10        let midAngleRad = startAngle.radians + (endAngle.radians - startAngle.radians)/2.0
11        return CGPoint(x: labelOffset * cos(midAngleRad),
12                       y: labelOffset * sin(midAngleRad))
13    }
14
15    var body: some View {
16        VStack {
17            Sector(
18                startAngle: startAngle,
19                endAngle: endAngle
20            )
21            .fill(color)
22            .overlay(
23                Text("\(value, specifier: "%.1f")")
24                    .font(.system(size: CGFloat(labelSize),
25                                  weight:.bold,
26                                  design: .rounded))
27                    .padding(4)
28                    .foregroundColor(.white)
29                    .background(Color(.black).opacity(0.3))
30                    .cornerRadius(5)
31                    .offset(x: labelPoint.x, y: labelPoint.y)
32            )
33        }
34    }
35}

Pie Chart with labels
A new Pie chart view with label is created that is similar to the original
PieChartView. In the ZStack for each of the sizes a SectorView is created rather
than a Sector shape previously.
 1struct PieChartWithLabelView: View {
 2    var sizes: [Double]
 3    var labelOffset : Double
 4    var labelSize: Double = 20.0
 5
 6    let angleOffset = 90.0
 7    let colors = [
 8        Color(red: 126/255, green: 40/255, blue: 80/255),
 9        Color(red: 49/255, green: 63/255, blue: 95/255),
10        Color(red: 37/255, green: 166/255, blue: 188/255),
11        Color(red: 130/255, green: 122/255, blue: 162/255),
12        Color(red: 241/255, green: 165/255, blue: 138/255)]
13
14    var body: some View {
15        let total = sizes.reduce(0, +)
16        let sortedSizes = sizes.sorted(by: >)
17        let angles = sizes.sorted(by: >).map { $0 * 360.0 / total }
18        var sum = 0.0
19        let runningAngles = angles.map { (sum += $0, sum).1 }
20
21        ZStack {
22            ForEach(0..<runningAngles.count) { i in
23                let startAngle = i==0 ? 0.0 : runningAngles[i-1]
24                SectorView(
25                    startAngle: Angle(degrees: startAngle - angleOffset),
26                    endAngle: Angle(degrees: runningAngles[i] - angleOffset),
27                    value: sortedSizes[i],
28                    color: colors[i % colors.count],
29                    labelOffset: labelOffset,
30                    labelSize: labelSize)
31            }
32        }
33    }
34}
Tis code shows examples of the Pie Charts with labels as well as showing how the pie chart size responds to fit the frame size.
 1    var body: some View {
 2        VStack(spacing:30) {
 3            PieChartWithLabelView(sizes: [30, 15, 9],
 4                                  labelOffset: 70)
 5                .frame(width: 280, height: 280)
 6
 7            PieChartWithLabelView(sizes: [3, 2, 6],
 8                                  labelOffset: 30,
 9                                  labelSize: 8)
10                .frame(width: 100, height: 100)
11
12            Spacer()
13        }
14    }

Conclusion
This article showed how to create a pie chart from sector shapes in SwiftUI. This is not meant to be a charting package, but it does demonstrate how to encapsulate functionality to create a Sector shape inside a Sector View and how to combine these views in a Pie chart view.