Plotly - Customise plotly toolbar
Plotly is an open-source graphing library for Python that is used to create interactive chart. Each chart displays a toolbar on the top right of the chart that contains a set of buttons to interact with the chart. These buttons provide functionality such as download an image of the chart, zoom in and out, pan, reset the axes as well as a logo with a link to Plotly.
The plotly toolbar is called the Modebar and the default is to display when when a cursor is hovered over the chart or the modebar area. The buttons displayed on the modebar vary depending on the type of chart such as 3D charts providing buttons for orbital rotation that do not appear on 2D charts.
All of these buttons can confuse users and sometimes clutter up the chart. It is possible to remove some of the buttons, but the mechanism is not that straight-forward. The configuration of the modebar is associated with the display of the chart and not tied with the creation of the chart itself. In this article a simple line chart is created and the modebar is modified when displaying the chart.
Show or hide the Modebar
The plotly chart can be displayed with the Modebar permanently visible or configured to not show at all.
Create the sample line chart
First create a dataframe with random data.
1samples = 15
2random.seed(42)
3df = pd.DataFrame({
4    'A': sorted([random.randint(1,100) for _ in range(15)]),
5    'B': sorted([random.randint(1,100) for _ in range(15)]),
6    'C': sorted([random.randint(1,100) for _ in range(15)]),
7    'D': sorted([random.randint(1,100) for _ in range(15)]),
8})
Create a line chart with the data in the dataframe.
 1# Create line chart using plotly.graph_objects
 2
 3bg_color = 'rgba(208, 225, 242, 1.0)'
 4line_color = 'rgba(75, 152, 201, 1.0)'
 5grid_color = 'rgba(75, 152, 201, 0.3)'
 6
 7y_max = 110
 8y_min = 0
 9x_min = 0
10x_max = 15
11
12fig = go.Figure()
13for c in df.columns:
14    fig.add_trace(go.Scatter(x = df.index,
15                             y = df[c],
16                             mode='lines',
17                             hoverinfo = 'text+name',
18                             name = c,
19                             hovertemplate = [f'''
20                                <b>{c}<b><br><br>
21                                Value: <b>{df[c][i]:.1F}</b><br>
22                                <extra></extra>
23                                ''' for i in range(len(df.index))]
24                            ))
25
26fig.update_layout(
27    # Set figure title
28    title = dict(
29        text = f'<b>Sample line chart</b>',
30        xref = 'container',
31        yref = 'container',
32        x = 0.5,
33        y = 0.9,
34        xanchor = 'center',
35        yanchor = 'middle',
36        font = dict(family = 'Droid Sans', size = 28)
37    ),
38    # set x-axis
39    xaxis = dict(
40        title = 'x-axis data',
41        range = [x_min, x_max],
42        linecolor = line_color,
43        linewidth = 2,
44        gridcolor = grid_color,
45        showticklabels = True,
46        ticks = 'outside',
47    ),
48    # set y-axis
49    yaxis = dict(
50        title = 'y-axis data',
51        range = [y_min, y_max],
52        linecolor = line_color,
53        linewidth = 2,
54        gridcolor = grid_color,
55        showticklabels = True,
56        ticks = 'outside',
57    ),
58    # set legend
59    legend = dict(
60        traceorder = 'normal',
61        font_size = 12,
62        x = 0.01,
63        y = 0.99,
64        xanchor = "left",
65        yanchor = "top"
66    ),
67    showlegend = True,
68    # set the plot bacground color
69    plot_bgcolor = bg_color,
70    paper_bgcolor = bg_color,
71)
72
73fig.show()
The default is to show the modebar only when a cursor is hovered over the chart or over the modebar.
Simple line chart with default Modebar behavior
Always show the Modebar
This Modebar can be configured to always display using displayModeBar property
in a dictionary of values for the config property of the show function.
1fig.show(config={"displayModeBar": True})
Line chart with Modebar always visible
Never show the Modebar
The Modebar can also be configured to never display using displayModeBar property
set to false. The three options for displayModeBar are 'hover', True, False. Hiding
the Modebar does not change the ability to interact with the chart; hover still works;
selecting an area zoomes in on this area and double-click resets the chart.
1fig.show(config={"displayModeBar": False})
Line chart with Modebar never visible
Remove the plotly logo from the Modebar
The Modebar includes the Plotly logo with a link to Plotly at the end of the
Modebar. This can be removed with displaylogo parameter.
1fig.show(config={"displaylogo": False})
Line chart without Plotly logo on Modebar
Remove specific buttons from the Modebar
Specific buttons can be removed from the Modebar using the modeBarButtonsToRemove
parameters. This takes a list of strings of the names of the buttons to remove from
the Modebar. The following is a list of all the modebar buttons, some of which are
only present on certain chart types.
Summary of the pandas.concat and dataframe.append:
Chart |
Button names |
|---|---|
| general | toImage, toggleHover, resetViews, sendDataToCloud, toggleSpikelines, resetViewMapbox, hoverClosestGl2d, hoverClosestPie, hoverClosestCartesian, hoverCompareCartesian |
| 2D | zoom2d, pan2d, select2d, lasso2d, zoomIn2d, zoomOut2d, autoScale2d, resetScale2d |
| 3D | zoom3d, pan3d, rbitRotation, tableRotation, handleDrag3d, resetCameraDefault3d, resetCameraLastSave3d, hoverClosest3d |
| Geo | zoomInGeo, zoomOutGeo, resetGeo, hoverClosestGeo |
 1fig.show(config={"displayModeBar": True,
 2                 "displaylogo": False,
 3                 'modeBarButtonsToRemove': [
 4                     'zoom2d',
 5                     'toggleSpikelines',
 6                     'pan2d',
 7                     'select2d',
 8                     'lasso2d',
 9                     'autoScale2d',
10                     'hoverClosestCartesian',
11                     'hoverCompareCartesian']})
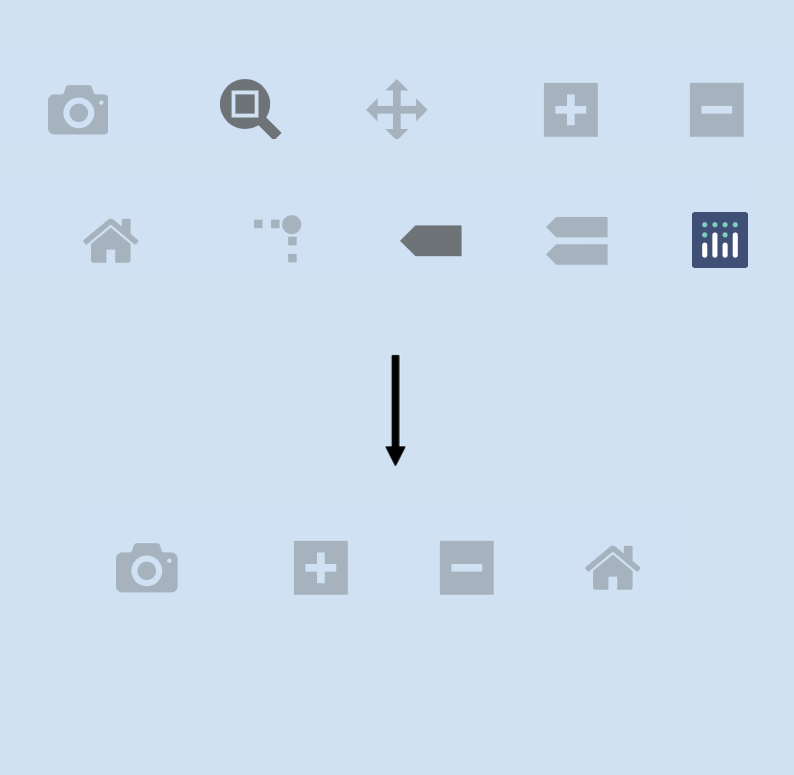
Line chart with "toggleSpikelines" "hoverCompareCartesian" buttons removed
Display a Plotly chart as a Static chart
A Plotly chart can be displayed as a static chart with the use of staticPlot
parameter, which is false by default. Displaying the chart as a static chart
automatically hides the Modebar as the plot is not interactive.
1fig.show(config={'staticPlot': True})
Plotly line chart displayed as static chart
Conclusion
Plotly is great for creating interactive charts that help bring the data to life. These interactive charts automatically default to displaying a toolbar on the top right called a "Modebar". This default Modebar can appear a bit cluttered and be confusing to viewers of the charts. The Modebar can be configured to always display or never display as well as limiting the buttons that are present in the Modebar.