Pandas - Load data from Excel file and Display Chart
Pandas is a Python package that provides fast data manipulation and analysis of
structured data. It has grown in popularity recently with the rise of data analytics
and machine learning. The source code for pandas is available on GitHub, but it is
more common to install the binary package using something like pip install pandas.
A core component of pandas is the dataframe that provides two-dimensional
table-like structure to store and manipulate data.
Pandas makes working with structured data easy using the flexible data structures provided. It has become an essential tool for doing practical data analysis in Python. Using Pandas in Jupyter notebooks is a very efficient way to load data and perform some high-level analysis and then visualize the data using Matplotlib.
Under-five mortality rate
I came across a book from Unicef called "state of the world's children" in 1995. This reports on key issues affecting children in various countries around the world and includes a large set of statistics in tabular format, which I found fascinating. Unicef works to improve child welfare throughout the world and continues to produce numerous reports including the state of the word's children. Unicef makes available a large amount of datasets for public consumption at Unicef Datasets. This article uses Under 5 Mortality Rate dataset.
Under-five mortality rate:
is the probability of dying between birth and exactly 5 years of age, expressed per 1,000 live births.
Pandas functions used in this article |
|
|---|---|
|
|
Python modules used in this article
1# import modules
2import matplotlib.pyplot as plt
3import shutil
4import pandas as pd
5import numpy as np
6import requests
7import os
Download the excel file
Use the following function to download any file to a temporary location. It is always better to copy data locally and then work with the local files.
 1def download_file(url):
 2    '''Download a file from url to local temp directory.
 3
 4    Keyword arguments:
 5    url  -- A fully qualified url file path
 6
 7    return: The fully qualified path to the downloaded file
 8    '''
 9    local_dir = '/tmp/data/'
10    if not os.path.exists(local_dir):
11        os.makedirs(local_dir)
12
13    local_file = local_dir + url.split('/')[-1]
14    r = requests.get(url, stream=True)
15    with open(local_file, 'wb') as f:
16        for chunk in r.iter_content(chunk_size=512*1024):
17            if chunk:
18                f.write(chunk)
19    return local_file
This function is used by passing in the url to the Excel file on under-five mortality rate.
1u5mr_url = 'https://data.unicef.org/wp-content/uploads/2020/09/Under-five-mortality-rate_2020.xlsx'
2u5mr_file = download_file(u5mr_url)
3
4print(f"local file = {u5mr_file}")
5# local file = /tmp/data/Under-five-mortality-rate_2020.xlsx
List the worksheets in an excel file
Loading an excel file into a Pandas dataframe is very straight forward with
read_excel() and it will default to loading the first worksheet in the Excel
file. It is also possible to find out what sheets are in an Excel file with
the following code. This shows that the file contains six worksheets and the
first one is the country estimates needed.
 1u5mr_xl = pd.ExcelFile(u5mr_file)
 2u5mr_xl.sheet_names
 3
 4
 5# output
 6'''
 7['Country estimates (both sexes)',
 8 'Regional & global (both sexes)',
 9 'Country estimates (Female)',
10 'Regional & global (Female)',
11 'Country estimates (Male)',
12 'Regional & global (Male)']
13 '''
Load excel worksheet into dataframe
First load the first worksheet into a dataframe and examine the data. Examine the
data in the dataframe using shape and head. The shape of the data is (601, 73),
which is 601 rows of data by 73 columns. The head of the dataframe shows the columns
do not have any names and there seems to be a lot of blank rows at the top.
DataFrame.head function returns the first n rows of the dataframe, the default is 5. The first 5 rows appear largely blank except for file information in the first column. The data can be seen to start at row index 13 - when the head function is passed 20 for the first 20 rows.
Displaying all 73 columns can be somewhat unwieldy so the DataFrame.iloc function
is used to display the first 20 rows for the first 5 columns. iloc is an integer
based indexing mechanism for selecting rows and columns by position. The tail
function can be used in a similar way to the head function except to display the last
n rows of the dataframe. iloc is used here as well to reduce the number of columns to
display.
 1u5mr_df = pd.read_excel(u5mr_file)
 2
 3# OR
 4# u5mr_df = pd.read_excel(u5mr_file, sheet_name = 'Country estimates (both sexes)')
 5
 6print(u5mr_df.shape)
 7"""
 8(601, 73)
 9"""
10
11u5mr_df.head()
12u5mr_df.head(20)
13
14print(u5mr_df.iloc[:20, 0:5])
15"""
16                                           Unnamed: 0    Unnamed: 1  UNICEF GLOBAL DATABASES [data.unicef.org]  Unnamed: 3  Unnamed: 4
170                                                 NaN           NaN                                        NaN         NaN         NaN
181                                                 NaN           NaN                                        NaN         NaN         NaN
192                           Child Mortality Estimates           NaN                                        NaN         NaN         NaN
203   Country-specific Under-five mortality rate, bo...           NaN                                        NaN         NaN         NaN
214                                                 NaN           NaN                                        NaN         NaN         NaN
225   Estimates generated by the UN Inter-agency Gro...           NaN                                        NaN         NaN         NaN
236              Downloaded from http://data.unicef.org           NaN                                        NaN         NaN         NaN
247                                                 NaN           NaN                                        NaN         NaN         NaN
258   Prepared by the Data and Analytics Section; Di...           NaN                                        NaN         NaN         NaN
269                        Contact us:  data@unicef.org           NaN                                        NaN         NaN         NaN
2710                                                NaN           NaN                                        NaN         NaN         NaN
2811                      Last update: 9 September 2020           NaN                                        NaN         NaN         NaN
2912                                                NaN           NaN                                        NaN         NaN         NaN
3013                                           ISO.Code  Country.Name                        Uncertainty.Bounds*      1950.5      1951.5
3114                                                AFG   Afghanistan                                      Lower         NaN         NaN
3215                                                AFG   Afghanistan                                     Median         NaN         NaN
3316                                                AFG   Afghanistan                                      Upper         NaN         NaN
3417                                                ALB       Albania                                      Lower         NaN         NaN
3518                                                ALB       Albania                                     Median         NaN         NaN
3619                                                ALB       Albania                                      Upper         NaN         NaN
37"""
38
39
40u5mr_df.tail()
41print(u5mr_df.iloc[-5:, 0:5])
42"""
43    Unnamed: 0                                         Unnamed: 1   UNICEF GLOBAL DATABASES [data.unicef.org]  Unnamed: 3  Unnamed: 4
44596        ZWE                                           Zimbabwe                                       Lower         NaN         NaN
45597        ZWE                                           Zimbabwe                                      Median         NaN         NaN
46598        ZWE                                           Zimbabwe                                       Upper         NaN         NaN
47599        NaN                                                NaN                                         NaN         NaN         NaN
48600        NaN  * Lower and Upper refer to the lower bound and...                                         NaN         NaN         NaN
49"""
It can be seen from the output above that the header row for the countries start at index 13. The data is reloaded from the excel file with an additional parameter specifying the header row. This could also be done using the skiprows. It also shows that the last two rows are there to contain a footnote.
Reload the excel file with the following code and review the data.
 1u5mr_df = pd.read_excel(
 2    u5mr_file,
 3    sheet_name = 'Country estimates (both sexes)',
 4    header = 14)
 5
 6print(u5mr_df.shape)
 7"""
 8(587, 73)
 9"""
10
11print(u5mr_df.iloc[:10, 0:8])
12"""
13  ISO.Code Country.Name Uncertainty.Bounds*  1950.5  1951.5  1952.5  1953.5      1954.5
140      AFG  Afghanistan               Lower     NaN     NaN     NaN     NaN         NaN
151      AFG  Afghanistan              Median     NaN     NaN     NaN     NaN         NaN
162      AFG  Afghanistan               Upper     NaN     NaN     NaN     NaN         NaN
173      ALB      Albania               Lower     NaN     NaN     NaN     NaN         NaN
184      ALB      Albania              Median     NaN     NaN     NaN     NaN         NaN
195      ALB      Albania               Upper     NaN     NaN     NaN     NaN         NaN
206      DZA      Algeria               Lower     NaN     NaN     NaN     NaN  181.095341
217      DZA      Algeria              Median     NaN     NaN     NaN     NaN  242.618134
228      DZA      Algeria               Upper     NaN     NaN     NaN     NaN  323.057628
239      AND      Andorra               Lower     NaN     NaN     NaN     NaN         NaN
24"""
25
26# Review columns on the right
27print(u5mr_df.iloc[:10, -7:])
28"""
29      2013.5     2014.5     2015.5     2016.5     2017.5     2018.5     2019.5
300  68.481212  64.526394  60.716842  57.068054  53.744798  50.640922  47.442070
311  76.830462  73.580267  70.444802  67.572190  64.940759  62.541196  60.269399
322  86.077559  83.378062  80.863431  78.646207  76.832873  75.405564  74.616041
333  10.072106   9.549495   9.225420   9.075629   9.044506   9.067390   9.068154
344  10.430484   9.896397   9.565251   9.419110   9.418052   9.525133   9.682407
355  10.821932  10.272281   9.936220   9.795035   9.826251  10.020056  10.348964
366  25.265117  24.944603  24.613434  24.245765  23.801969  23.262592  22.513380
377  25.784460  25.478560  25.177142  24.792098  24.319482  23.805926  23.256168
388  26.310524  26.023294  25.746094  25.339485  24.843878  24.345820  24.025946
399   1.566198   1.384200   1.232419   1.098862   0.985541   0.910653   0.847791
40"""
Rename the columns to contain the Year
Drop the last two rows that are there to include the footnote.
 1# Drop the last two rows
 2print(u5mr_df.shape)
 3"""
 4(587, 73)
 5"""
 6
 7u5mr_df.drop(u5mr_df.tail(2).index, inplace = True)
 8
 9print(u5mr_df.shape)
10"""
11(585, 73)
12"""
13
14u5mr_df.tail()
15print(u5mr_df.iloc[-5:, 0:7])
16"""
17    ISO.Code Country.Name Uncertainty.Bounds*  1950.5  1951.5  1952.5      1953.5
18580      ZMB       Zambia              Median     NaN     NaN     NaN  234.418232
19581      ZMB       Zambia               Upper     NaN     NaN     NaN  308.531403
20582      ZWE     Zimbabwe               Lower     NaN     NaN     NaN         NaN
21583      ZWE     Zimbabwe              Median     NaN     NaN     NaN         NaN
22584      ZWE     Zimbabwe               Upper     NaN     NaN     NaN         NaN
23"""
The year headings contain 0.5 such as 2019.5 probably to indicate a mean value for
the entire year. Use columns field of the dataframe to rename these to just the
full year. u5mr_df.columns is a list of all the columns in the dataframe and
a list comprehension is used to remove the ".5" if it is there.
The asterisk (*) is also removed from the 'Uncertainty.Bounds*' column name.
 1print(u5mr_df.columns)
 2
 3"""
 4Index(['ISO.Code', 'Country.Name', 'Uncertainty.Bounds*', '1950.5', '1951.5',
 5       '1952.5', '1953.5', '1954.5', '1955.5', '1956.5', '1957.5', '1958.5',
 6       '1959.5', '1960.5', '1961.5', '1962.5', '1963.5', '1964.5', '1965.5',
 7       '1966.5', '1967.5', '1968.5', '1969.5', '1970.5', '1971.5', '1972.5',
 8       '1973.5', '1974.5', '1975.5', '1976.5', '1977.5', '1978.5', '1979.5',
 9       '1980.5', '1981.5', '1982.5', '1983.5', '1984.5', '1985.5', '1986.5',
10       '1987.5', '1988.5', '1989.5', '1990.5', '1991.5', '1992.5', '1993.5',
11       '1994.5', '1995.5', '1996.5', '1997.5', '1998.5', '1999.5', '2000.5',
12       '2001.5', '2002.5', '2003.5', '2004.5', '2005.5', '2006.5', '2007.5',
13       '2008.5', '2009.5', '2010.5', '2011.5', '2012.5', '2013.5', '2014.5',
14       '2015.5', '2016.5', '2017.5', '2018.5', '2019.5'],
15      dtype='object')
16"""
17
18u5mr_df.columns = [x[:-2] if x.endswith('.5') else x for x in u5mr_df.columns]
19
20u5mr_df = u5mr_df.rename(columns={'Uncertainty.Bounds*': 'Uncertainty.Bounds'})
21
22print(u5mr_df.columns)
23"""
24Index(['ISO.Code', 'Country.Name', 'Uncertainty.Bounds', '1950', '1951',
25       '1952', '1953', '1954', '1955', '1956', '1957', '1958', '1959', '1960',
26       '1961', '1962', '1963', '1964', '1965', '1966', '1967', '1968', '1969',
27       '1970', '1971', '1972', '1973', '1974', '1975', '1976', '1977', '1978',
28       '1979', '1980', '1981', '1982', '1983', '1984', '1985', '1986', '1987',
29       '1988', '1989', '1990', '1991', '1992', '1993', '1994', '1995', '1996',
30       '1997', '1998', '1999', '2000', '2001', '2002', '2003', '2004', '2005',
31       '2006', '2007', '2008', '2009', '2010', '2011', '2012', '2013', '2014',
32       '2015', '2016', '2017', '2018', '2019'],
33      dtype='object')
34"""
Filter to the Median values
The data has three values for each country the Lower and Upper bounds and the Median. Create a copy of the dataframe with just the Median values, so there is only one number for each country.
 1u5mr_med_df = u5mr_df[u5mr_df['Uncertainty.Bounds'] == 'Median']
 2print(u5mr_med_df.shape)
 3"""
 4(195, 73)
 5"""
 6
 7u5mr_med_df.head()
 8print(u5mr_med_df.iloc[:10, :10])
 9"""
10   ISO.Code         Country.Name Uncertainty.Bounds        1950        1951        1952        1953        1954        1955        1956
111       AFG          Afghanistan             Median         NaN         NaN         NaN         NaN         NaN         NaN         NaN
124       ALB              Albania             Median         NaN         NaN         NaN         NaN         NaN         NaN         NaN
137       DZA              Algeria             Median         NaN         NaN         NaN         NaN  242.618134  242.066662  241.601453
1410      AND              Andorra             Median         NaN         NaN         NaN         NaN         NaN         NaN         NaN
1513      AGO               Angola             Median         NaN         NaN         NaN         NaN         NaN         NaN         NaN
1616      ATG  Antigua and Barbuda             Median  119.066130  116.624640  114.074405  111.406742  108.602334  105.661011  102.585410
1719      ARG            Argentina             Median         NaN         NaN         NaN         NaN         NaN         NaN         NaN
1822      ARM              Armenia             Median         NaN         NaN         NaN         NaN         NaN         NaN         NaN
1925      AUS            Australia             Median   31.584087   30.966060   30.261701   29.496194   28.711058   27.961205   27.265216
2028      AUT              Austria             Median   83.482005   73.820239   66.122978   60.263643   56.225511   53.524855   51.536432
21"""
Get data for the top 10 countries in the latest year
The data is sorted by the values in the last column and the number of rows reduced to ten to reduce the data to the top 10 countries.
 1u5mr_med_df.sort_values(by=u5mr_df.columns[-1], ascending=False).head(10)
 2
 3highest_df = u5mr_med_df.sort_values(by=u5mr_df.columns[-1], ascending=False).head(10)
 4print(highest_df.iloc[:, [0,1,-5,-4,-3,-2,-1]])
 5"""
 6    ISO.Code              Country.Name        2015        2016        2017        2018        2019
 7376      NGA                   Nigeria  126.833543  125.040170  122.798947  120.037728  117.202078
 8481      SOM                   Somalia  132.720296  128.428442  124.393442  120.326222  116.972096
 9100      TCD                      Chad  129.406257  125.604878  121.508350  117.664883  113.790418
1097       CAF  Central African Republic  126.714463  121.593307  117.470988  114.222380  110.053912
11466      SLE              Sierra Leone  138.342774  123.232842  118.222181  113.544491  109.236528
12214      GIN                    Guinea  107.852191  105.241523  103.226528  101.095543   98.802973
13487      SSD               South Sudan   96.229299   96.229299   96.229299   96.229299   96.229299
14316      MLI                      Mali  108.586504  104.766458  101.062422   97.410316   94.035418
1555       BEN                     Benin   99.592931   97.416395   95.133079   92.773521   90.286429
1679       BFA              Burkina Faso  100.671924   97.034768   93.862909   90.682138   87.542426
17"""
Create a chart for the top 10 countries in the latest year
Create a line chart using Matplotlib to show the changes in the under-five mortality rate over time. The data needs to be transposed and tidyied up a bit in order to create a line chart using year as the x axis values.
The following steps are done to prepare the data for the chart.
- Transpose the data so year can be used as the x-axis
- Set the Country.Name as the heading for the columns
- Rename the Country.Name column to Year
- Drop the rows that do not contain u5mr data
 1# Need to transpose the dataframe to use year as the x-axis
 2top_10_df = u5mr_med_df.sort_values(by=u5mr_df.columns[-1], ascending=False).head(10).T
 3top_10_df.reset_index(drop=False,inplace=True)
 4print(f"shape = {top_10_df.shape}")
 5top_10_df.head()
 6
 7# Set the Country.Name as the heading for the columns
 8top_10_df.columns = top_10_df.iloc[np.where(top_10_df['index'] == 'Country.Name')[0][0]]
 9print(f"shape = {top_10_df.shape}")
10top_10_df.head()
11
12# Rename the Country.Name column to Year
13top_10_df = top_10_df.rename(columns={'Country.Name': 'Year'})
14print(f"shape = {top_10_df.shape}")
15top_10_df.head()
16
17# Drop the rows that do not contain u5mr data
18top_10_df = top_10_df[top_10_df['Year'].isin(['ISO.Code', 'Country.Name', 'Uncertainty.Bounds']) == False]
19top_10_df.reset_index(drop = True, inplace = True)
20print(f"shape = {top_10_df.shape}")
21top_10_df.head()
22
23print(top_10_df.tail())
24"""
251   Year  Nigeria  Somalia     Chad Central African Republic Sierra Leone   Guinea South Sudan     Mali    Benin Burkina Faso
2665  2015  126.834   132.72  129.406                  126.714      138.343  107.852     96.2293  108.587  99.5929      100.672
2766  2016   125.04  128.428  125.605                  121.593      123.233  105.242     96.2293  104.766  97.4164      97.0348
2867  2017  122.799  124.393  121.508                  117.471      118.222  103.227     96.2293  101.062  95.1331      93.8629
2968  2018  120.038  120.326  117.665                  114.222      113.544  101.096     96.2293  97.4103  92.7735      90.6821
3069  2019  117.202  116.972   113.79                  110.054      109.237   98.803     96.2293  94.0354  90.2864      87.5424
31"""
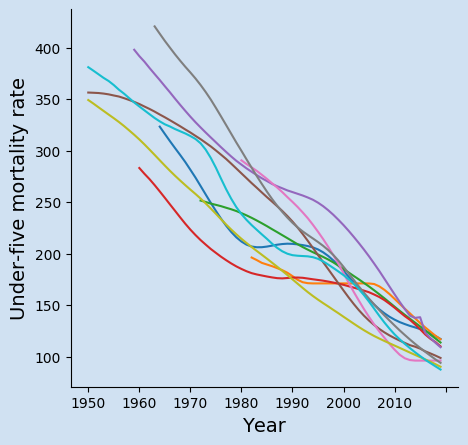
Create a chart for countries with highest U5MR
The code below creates the line chart of the changes to under-five mortality rate in the countries with the current highest rates.
 1current_year = u5mr_df.columns[-1]
 2title = f'Changes in Under 5 Mortality Rate\nfor countries with the highest in {u5mr_df.columns[-1]}'
 3
 4fig, ax1 = plt.subplots(figsize=(10,7), facecolor=plt.cm.Blues(.2))
 5ax1.set_facecolor(plt.cm.Blues(.2))
 6
 7fig.suptitle(title, fontsize=18,  fontweight='bold')
 8
 9top_10_df.plot(kind = "line",
10               x = "Year",
11               y = top_10_df.columns[1:],
12               ax = ax1)
13
14ax1.legend(bbox_to_anchor = (0.5, -0.1),
15           loc='upper center',
16           ncol = 3,
17           frameon = False,
18           fontsize = 'medium')
19
20ax1.set_ylabel('Under-five mortality rate', fontsize=14)
21ax1.set_xlabel('Year', fontsize=14)
22
23# Hide the right and top spines
24ax1.spines['right'].set_visible(False)
25ax1.spines['top'].set_visible(False)
26
27plt.show()

Create a chart for countries with lowest U5MR
A similar chart was created by reversing the sort order of the mortality rates in the latest year after performing the data clean. These two functions were created to make the creation of the charts more consistent and reproducible.
Function to extract the mortality rates for the top countries.
 1def get_top_countries(data_df, lowest = True, num = 10):
 2    '''Extract the mortality rates for the top number of countries
 3    based on rates in the latest year
 4
 5    Keyword arguments:
 6    data_df  -- dateframe of all the mortality rates for all the countries
 7    lowest   -- boolean flag to either contries withe the lowest rate
 8                or highest rate (default is True)
 9    num.     -- number of countries to return (default is 10)
10
11    return: dataframe that has been transposed and filtered to the top n counbtries
12    '''
13    # Need to transpose the dataframe to use year as the x-axis
14    df = data_df.sort_values(by=data_df.columns[-1], ascending=lowest).head(10).T
15    df.reset_index(drop=False,inplace=True)
16
17    # Set the Country.Name as the heading for the columns
18    df.columns = df.iloc[np.where(df['index'] == 'Country.Name')[0][0]]
19
20    # Rename the Country.Name column to Year
21    df = df.rename(columns={'Country.Name': 'Year'})
22
23    # Drop the rows that do not contain u5mr data
24    df = (df[df['Year']
25             .isin(['ISO.Code',
26                    'Country.Name',
27                    'Uncertainty.Bounds']) == False]
28        )
29    df.reset_index(drop = True, inplace = True)
30
31    return df
Function to create the chart of the mortality rates over time.
 1def create_line_chart(df, title):
 2    '''Create a line chart of the mortality rates over time.
 3    Year is required to be in the first column.
 4
 5    Keyword arguments:
 6    df     -- dataframe of the the countries to render in the chart.
 7    title  -- text to display for the title of the chart
 8
 9    return: figure of the chart
10    '''
11    fig, ax1 = plt.subplots(figsize=(10,7), facecolor=plt.cm.Blues(.2))
12    ax1.set_facecolor(plt.cm.Blues(.2))
13
14    fig.suptitle(title, fontsize=18,  fontweight='bold')
15
16    df.plot(kind = "line",
17            x = "Year",
18            y = df.columns[1:],
19            ax = ax1)
20
21    ax1.legend(bbox_to_anchor = (0.5, -0.1),
22               loc='upper center',
23               ncol = 3,
24               frameon = False,
25               fontsize = 'medium')
26
27    ax1.set_ylabel('Under-five mortality rate', fontsize=14)
28    ax1.set_xlabel('Year', fontsize=14)
29
30    # Hide the right and top spines
31    ax1.spines['right'].set_visible(False)
32    ax1.spines['top'].set_visible(False)
33
34    return fig

Conclusion
Under-Five Mortality Rate
Under-five mortality rate is one of the key development metrics for countries. The results of the current countries with highest continue to decrease year over year. However, some countries such as South Sudan and Somalia seem to have levelled off in recent years. These top ten countries all have U5MR close to 100, that is the expectation that 100 out of every 1,000 live births will die before the age of 5-years of age. This means one in ten people die before the age of five - this is alarming.
All of these ten countries have had high Under-Five Mortality Rate for the last fifty years and they are all improving. The highest rate in this chart is for Mali in 1963 when the Under-Five Mortality Rate was 420. This is an incomprehensible number implying that four out of every ten children are likely to die before the age of 5.
It can be seen that all but one of the top countries with the lowest Under-Five Mortality Rate started at less than 100 in 1950.
Pandas
Pandas is great for loading and manipulating structured data. It is very easy to load data from Excel into a dataframe. Dataframe is also great for filtering, sorting and transposing data as well as creating charts from the data. Pandas can be used in a Jupyter Notebook for interactive exploration of data so that a data processing pipeline can be quickly developed. The final methods can then be used in a python script to repeatedly process similar files and produce consistent output.