How to add a footnote to a chart in Matplotlib
It can be nice to add a footnote or a header note to a Matplotlib chart. The easiest way to do this is with annotate function. The exact position, size orientation can be controlled and multiple notes can be added to charts.
Create a simple line chart
Create a simple line chart with three sets of ten random points to show a line chart.
 1# Create the data
 2samples = 10
 3random.seed(42) # seed used to keep the same random points on repeated runs
 4val1 = sorted([random.randint(1,100) for _ in range(samples)])
 5val2 = sorted([random.randint(1,100) for _ in range(samples)])
 6val3 = sorted([random.randint(1,100) for _ in range(samples)])
 7x_val = list(range(samples))
 8
 9# Create a line chart
10fig, ax = plt.subplots(figsize=(10,7), facecolor=plt.cm.Blues(.2))
11ax.set_facecolor(plt.cm.Blues(.2))
12ax.set_title("Sample Line Chart", fontsize=18, fontweight='bold')
13
14ax.plot(x_val, val1, color = plt.cm.cool(0.3), marker='o', markersize=8)
15ax.plot(x_val, val2, color = plt.cm.cool(0.6), marker='*', markersize=8)
16ax.plot(x_val, val3, color = plt.cm.cool(0.9), marker='x', markersize=8)
17
18ax.set_xlabel('X label', fontsize=16)
19ax.set_ylabel('Y label', fontsize=16)
20
21# Hide the right and top spines
22ax.spines['right'].set_visible(False)
23ax.spines['top'].set_visible(False)
24
25# Don't show any ticks on any spine
26ax.yaxis.set_ticks_position('none')
27ax.xaxis.set_ticks_position('none')
28
29ax.tick_params(labelsize = 14)
30
31plt.show()

Add a note to the chart
Use annotate to add a note to the chart with the addition of the following code. The default for the xy values is to use the units of the chart and this is very useful when adding annotations to data points.
1...
2
3ax.tick_params(labelsize = 14)
4
5# Add a note
6ax.annotate('Note added to chart with minimum parameters', xy = (5, 5))
7
8fig.tight_layout()
9plt.show()

Add a note outside the chart
The xycoords parameter is used to specify the coordinate system that xy
is given in. xycoords value of 'axes fraction' is used to specify coordinates
as a fraction of axes from lower left. This sets the coordinate system for
the annotation to use (0,0) to (1,1) for the entire chart, regardless of the
chart scales.
The following adds a note at each of the corners of the chart.
 1...
 2
 3ax.tick_params(labelsize = 14)
 4
 5# Add a four notes
 6ax.annotate('Note added at (0,0)', xy = (0, 0), xycoords='axes fraction')
 7ax.annotate('Note added at (0,1)', xy = (0, 1), xycoords='axes fraction')
 8ax.annotate('Note added at (1,0)', xy = (1, 0), xycoords='axes fraction')
 9ax.annotate('Note added at (1,1)', xy = (1, 1), xycoords='axes fraction')
10
11fig.tight_layout()
12plt.show()

The notes are added at the 4 corners of the chart and the default is that this is where the text in the annotation starts and the text is left-justified. More space is added to the right of the chart to allow for the notes to be displayed.
Add random notes inside and outside the chart
The following code adds fifty notes at random locations from (-1.0, -1.0) to (2.0, 2.0). This demonstrates that annotations can be added outside the chart knowing that the chart is in (0,0) to (1,1). The plot resizes to show these annotations. Each note shows the coordinates at which it was added and these notes can be placed on top of each other as well as other chart elements.
 1...
 2
 3ax.tick_params(labelsize = 14)
 4
 5# Add 50 notes at random locations
 6for i in range(50):
 7    x = random.randint(-10,20)/10
 8    y = random.randint(-10,20)/10
 9    ax.annotate(f'Note added at ({x:.1f}, {y:.1f})',
10                xy = (x, y),
11                xycoords='axes fraction')
12
13fig.tight_layout()
14plt.show()

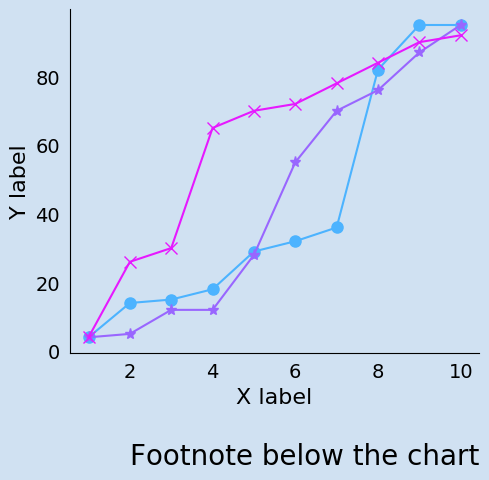
Add a single note below the chart
Add a note below and to the right of the chart. In addition, the note can be formatted and right-justified.
 1...
 2
 3ax.tick_params(labelsize = 14)
 4
 5# Add a footnote below and to the right side of the chart
 6ax.annotate('Footnote added below the chart with a smaller font',
 7            xy = (1.0, -0.2),
 8            xycoords='axes fraction',
 9            ha='right',
10            va="center",
11            fontsize=10)
12
13
14fig.tight_layout()
15plt.show()

Conclusion
In Matplotlib, annotate can be used to add any note or any number of notes anywhere on or around charts. Annotate defaults to using the coordinate system of the chart and can be used to add text to particular data points. With the use of xycoords set to 'axes fraction' the coordinate system for the annotation sets the chart to a single cell from 0 to 1. This allows exact positioning of annotations inside or outside the chart.