Pandas - How to use iloc and loc
Pandas dataframes can store very large amounts of data and iloc and loc
can be used to slice and dice the data into manageable chunks.
Summary of iloc and loc functions |
||
|---|---|---|
| Select a row | df.iloc[3] | df.loc['data_5'] |
| Select a column | df.iloc[:, 3] | df.loc[:, 'indigo'] |
| Select a cell | df.iloc[2, 3] | df.loc['data_2_', 'indigo'] |
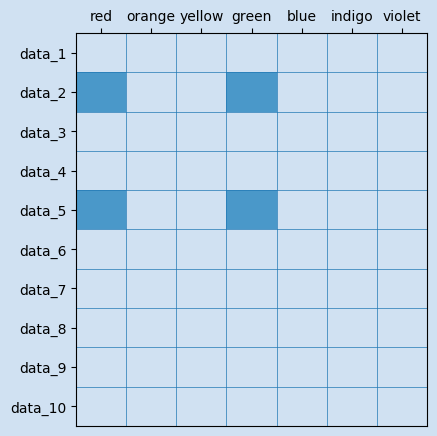
| Select rows and columns | df.iloc[[0,1,2,-3,-2,-1], [0,1,-2,-1]] | df.loc[['data_2', 'data_5'], ['green', 'red']] |
| Select sequence of rows and columns | df.iloc[2:3, 4:] | df.loc['data_2':'data_5', 'red':'green'] |
Python modules used in this article
1# import modules
2import pandas as pd
3import numpy as np
iloc
iloc is integer index based method of selecting rows and columns from a Pandas
dataframe. This can be used in a variety of ways to slice and dice a dataframe.
iloc can take one or two parameters, the first parameter specifies the row index
and the second specifies the column index. The entire row is returned when just one
parameter is used.
There is also flexibility in the parameters passed in; either an integer; a list of integers; an array slice; or a callable function
Create dataframe with sample data
A dataframe was created with a sequence of numbers for the colors of the rainbow. The index is changed to be text data to illustrate that it is independent of the iloc integer number.
 1
 2# Create Dataframe
 3d = {}
 4for i,c in enumerate(['red', 'orange', 'yellow', 'green', 'blue', 'indigo', 'violet']):
 5    d[c] = [(10*i)+x for x in range(10)]
 6df = pd.DataFrame(d, index = [f'data_{x+1}' for x in range(10)])
 7
 8print(df.shape)
 9"""
10(10, 7)
11"""
12
13print(df)
14"""
15         red  orange  yellow  green  blue  indigo  violet
16data_1     0      10      20     30    40      50      60
17data_2     1      11      21     31    41      51      61
18data_3     2      12      22     32    42      52      62
19data_4     3      13      23     33    43      53      63
20data_5     4      14      24     34    44      54      64
21data_6     5      15      25     35    45      55      65
22data_7     6      16      26     36    46      56      66
23data_8     7      17      27     37    47      57      67
24data_9     8      18      28     38    48      58      68
25data_10    9      19      29     39    49      59      69
26"""
Retrieve a single row of data with iloc
A single row is returned by passing in the index of the row to retrieve.
Note that the index is zero-based, so that iloc[3] returns the fourth row
in the dataframe. Passing an index that is out of bounds of the dataframe
will throw an error. The single row is returned as a series.
 1df.iloc[3]
 2
 3"""
 4red        3
 5orange    13
 6yellow    23
 7green     33
 8blue      43
 9indigo    53
10violet    63
11Name: data_4, dtype: int64
12"""
13
14print(type(df.iloc[3]))
15"""
16<class 'pandas.core.series.Series'>
17"""

iloc
Retrieve multiple rows of data with iloc
A list of row indexes can be passed in to select the selected rows.
1df.iloc[[3,4,8]]
2
3"""
4        red  orange  yellow  green  blue  indigo  violet
5data_4    3      13      23     33    43      53      63
6data_5    4      14      24     34    44      54      64
7data_9    8      18      28     38    48      58      68
8"""
The list of indexes can contain just a single index, which will return just the selected row in a dataframe.
 1df.iloc[[3]]
 2
 3"""
 4        red  orange  yellow  green  blue  indigo  violet
 5data_4    3      13      23     33    43      53      63
 6"""
 7
 8print(type(df.iloc[[3]]))
 9"""
10<class 'pandas.core.frame.DataFrame'>
11"""
Any valid array slice or list comprehension can be used to specify the list of row indexes to be selected.
 1# Array slice from 2 to 5
 2df.iloc[2:5]
 3"""
 4        red  orange  yellow  green  blue  indigo  violet
 5data_3    2      12      22     32    42      52      62
 6data_4    3      13      23     33    43      53      63
 7data_5    4      14      24     34    44      54      64
 8"""
 9
10
11# Array from 1 to the end in steps of 3
12df.iloc[1::3]
13"""
14        red  orange  yellow  green  blue  indigo  violet
15data_2    1      11      21     31    41      51      61
16data_5    4      14      24     34    44      54      64
17data_8    7      17      27     37    47      57      67
18"""
19
20
21# Array from 8 to the end
22df.iloc[8:]
23"""
24         red  orange  yellow  green  blue  indigo  violet
25data_9     8      18      28     38    48      58      68
26data_10    9      19      29     39    49      59      69
27"""
28
29# Array specifying the first and last 2 rows
30df.iloc[[0,1,-2,-1]]
31"""
32         red  orange  yellow  green  blue  indigo  violet
33data_1     0      10      20     30    40      50      60
34data_2     1      11      21     31    41      51      61
35data_9     8      18      28     38    48      58      68
36data_10    9      19      29     39    49      59      69
37"""

iloc
Retrieving data using Row and Column Index
Two parameters can be passed in to iloc to specify the row and the column indexes.
The two parameters are separated by a comma "," and the entire column can be selected
by using ":" for the first parameter.
 1# Select a single cell at row 3 and column 5
 2df.iloc[3, 5]
 3"""
 453
 5"""
 6
 7# Select all of column 5
 8df.iloc[:, 5]
 9"""
10data_1     50
11data_2     51
12data_3     52
13data_4     53
14data_5     54
15data_6     55
16data_7     56
17data_8     57
18data_9     58
19data_10    59
20Name: indigo, dtype: int64
21"""
22
23# Select all of column 2 and 5
24df.iloc[:, [2,5]]
25"""
26         yellow  indigo
27data_1       20      50
28data_2       21      51
29data_3       22      52
30data_4       23      53
31data_5       24      54
32data_6       25      55
33data_7       26      56
34data_8       27      57
35data_9       28      58
36data_10      29      59
37"""

iloc
Retrieve a sub grid from a dataframe
iloc returns a sub grid from a dataframe when a range of rows and a range of columns are used. It can be useful to return the four corners of a dataframe when working with large datasets.
 1df.iloc[2:5, 2:5]
 2"""
 3        yellow  green  blue
 4data_3      22     32    42
 5data_4      23     33    43
 6data_5      24     34    44
 7
 8# select four corners
 9df.iloc[[0,1,2,-3,-2,-1], [0,1,-2,-1]]
10"""
11         red  orange  indigo  violet
12data_1     0      10      50      60
13data_2     1      11      51      61
14data_3     2      12      52      62
15data_8     7      17      57      67
16data_9     8      18      58      68
17data_10    9      19      59      69
18"""

iloc
loc
loc is label-based method of selecting rows and columns from a Pandas
dataframe. This can also be used in a variety of ways to slice and dice a dataframe.
loc can take one parameter or two parameters corresponding to the labels
of the row index and the column names. There is the same flexibility as iloc
in the parameters passed in; either an index label; a list of index labels;
an array slice; or a callable function.
Passing an index label that is not in the dataframe throws an error.
Retrieve Row data with loc
Passing a single parameter retrieves the entire row for index labels matching the parameter. The row is returned as a series.
 1df.loc['data_5']
 2"""
 3red        4
 4orange    14
 5yellow    24
 6green     34
 7blue      44
 8indigo    54
 9violet    64
10Name: data_5, dtype: int64
11"""
Retrieve multiple rows with loc
A list of index labels returns the corresponding rows. A list of just one index label returns a dataframe with just one row.
 1df.loc[['data_2', 'data_5']]
 2"""
 3        red  orange  yellow  green  blue  indigo  violet
 4data_2    1      11      21     31    41      51      61
 5data_5    4      14      24     34    44      54      64
 6"""
 7
 8# A list of just one index label
 9df.loc[['data_5']]
10"""
11        red  orange  yellow  green  blue  indigo  violet
12data_5    4      14      24     34    44      54      64
13"""
A slice object of index labels returns the corresponding rows, inclusive of the stop index (this is different to usual python slices). Specifying the index labels in the wrong order will return an empty dataframe.
 1# loc slice includes the start and stop index
 2df.loc['data_2':'data_5']
 3"""
 4        red  orange  yellow  green  blue  indigo  violet
 5data_2    1      11      21     31    41      51      61
 6data_3    2      12      22     32    42      52      62
 7data_4    3      13      23     33    43      53      63
 8data_5    4      14      24     34    44      54      64
 9"""
10
11# compare to iloc slice that does not include the stop index
12df.iloc[1:4]
13"""
14        red  orange  yellow  green  blue  indigo  violet
15data_2    1      11      21     31    41      51      61
16data_3    2      12      22     32    42      52      62
17data_4    3      13      23     33    43      53      63
18"""
19
20# Specifying the index labels in the wrong order will return an empty dataframe
21df.loc['data_5':'data_2']
22# equivalent to df.loc[[]]
23"""
24Empty DataFrame
25Columns: [red, orange, yellow, green, blue, indigo, violet]
26Index: []
27"""
28
29# All rows from data_8 to the end
30df.loc['data_8':]
31"""
32         red  orange  yellow  green  blue  indigo  violet
33data_8     7      17      27     37    47      57      67
34data_9     8      18      28     38    48      58      68
35data_10    9      19      29     39    49      59      69
36"""
loc can take a boolean array of the same length as the axis being sliced. This boolean array is usually created as the result of applying some other logic to the data set. This first example finds the rows where the value for 'yellow' is greater than 26. The logic to filter the data can get more complicated to narrow down to the data of interese once the logic creates a boolean array of the same length of the axis.
 1df['yellow'] > 26
 2"""
 3data_1     False
 4data_2     False
 5data_3     False
 6data_4     False
 7data_5     False
 8data_6     False
 9data_7     False
10data_8      True
11data_9      True
12data_10     True
13Name: yellow, dtype: bool
14"""
15
16# All rows where yellow values are greater than 26
17df.loc[df['yellow'] > 26]
18"""
19         red  orange  yellow  green  blue  indigo  violet
20data_8     7      17      27     37    47      57      67
21data_9     8      18      28     38    48      58      68
22data_10    9      19      29     39    49      59      69
23"""
24
25# All rows where yellow is a multiple of 2 and green is a multiple of 3
26df.loc[(df['yellow'] % 2 == 0) & (df['green'] % 3 == 0)]
27"""
28        red  orange  yellow  green  blue  indigo  violet
29data_1    0      10      20     30    40      50      60
30data_7    6      16      26     36    46      56      66
31"""
Retrieve Rows and Columns with loc
Similar to iloc, two parameters can be used for row labels and column labels.
Use df.index to see a list of all the index labels and df.columns to see
a list of all the column.
 1print(df.index)
 2"""
 3Index(['data_1', 'data_2', 'data_3', 'data_4', 'data_5', 'data_6', 'data_7',
 4       'data_8', 'data_9', 'data_10'],
 5      dtype='object')
 6"""
 7
 8print(df.columns)
 9"""
10Index(['red', 'orange', 'yellow', 'green', 'blue', 'indigo', 'violet'], dtype='object')
11"""
12
13# Select a single cell - data_8 for indigo
14df.loc['data_8', 'indigo']
15"""
1657
17"""
Select the entire column by passing : as the first parameter.
 1# select full column for indigo and red
 2df.loc[:, ['indigo', 'red']]
 3"""
 4         indigo  red
 5data_1       50    0
 6data_2       51    1
 7data_3       52    2
 8data_4       53    3
 9data_5       54    4
10data_6       55    5
11data_7       56    6
12data_8       57    7
13data_9       58    8
14data_10      59    9
15"""
16
17
18df.loc[['data_2', 'data_5'], ['green', 'red']]
19"""
20        green  red
21data_2     31    1
22data_5     34    4
23"""
24
25df.loc[(df['yellow'] % 2 == 0) & (df['green'] % 3 == 0), ['yellow', 'blue']]
26"""
27        yellow  blue
28data_1      20    40
29data_7      26    46
30"""

loc
Conclusion
iloc and loc are very useful and powerful methods to quickly filter down
data in a dataframe. Both are index-based for the rows and column-based for
the columns. iloc retrieves data based on the index specified for the row and/or
column, whereas loc is based on the values of the index and the values of the
columns. iloc can be useful to sample data based on position in the dataframe
without needing to know mush about the data. loc is more useful to filter
down the data based on specific rows and column data.
Both methods can accept one or two parameters and return single cell content or a range of rows or columns or specific intersections of rows and columns.